Engine Works
Under the hood of Alteryx: tips, tricks and how-tos.- Community
- :
- Community
- :
- Learn
- :
- Blogs
- :
- Engine Works
- :
- Designer Cloud and Reporting: Coffee & Tea Sales
- Subscribe to RSS Feed
- Mark as New
- Mark as Read
- Bookmark
- Subscribe
- Printer Friendly Page
- Notify Moderator
Let’s use Designer Cloud & Reporting to solve the weekly challenge 363.
According to the Harvard School of Public Health, tea and coffee are the two most consumed beverages on the planet after water. They are brimming with antioxidants and other biologically active substances that may benefit your health.
For this week's challenge, we will use a dataset containing information about the sales of coffee and tea in the USA for a 6-month period.
Here are the questions we want to answer using the data provided:
- Which state is the biggest consumer of regular coffee?
- Which state is the biggest consumer of decaf coffee?
- What type of coffee drink is the most popular?
- Which state is the biggest consumer of regular tea?
- Which state is the biggest consumer of decaf tea?
- What type of tea drink is the most popular?
Sample data:
Background
What is Designer Cloud?
Designer Cloud is the only open and interactive data engineering cloud platform to collaboratively profile, prepare, and pipeline data for analytics and machine learning. Designer Cloud provides an interactive, visual user experience that uses AI/ML-based suggestions to guide you and your data teams through the exploration and transformation of any dataset.
What is Reporting?
Reporting is an intuitive report builder that helps data workers frictionlessly share data insights across all levels of an enterprise. Alteryx Analytics Cloud Platform makes it easy to create personalized data visualizations, export and share reports with anyone, and consume data that helps make intelligent decisions.
Solution Approach
We are going to use the following products:
- Designer Cloud
- Data preparation and manipulation
- Reporting
- Results visualization
Data Preparation and Manipulation
Download the CSV file and load it into your solution (see this post for more information about reading and writing CSV files). Let’s load the data: Drag the Input Data tool from the Tool panel and drop it into the canvas, then proceed to select the Coffee_Tea_Sales.csv file.
Once the data is loaded, we need to re-configure the data types (By default, all the field types are strings when importing data from a CSV file). Changing the type of variable (for example, from string to float) can be done using the Select tool. Select the desired variables from the Select tool configuration panel to the right and change from String to Float type to perform SUMs and AGGREGATIONS on them.
We can review the changes by looking at the Metadata View icon and comparing the Input to the Output of the Select tool.
Now that the variables have the right type let’s aggregate the data to answer the questions.
Designer Cloud lets you perform arithmetic functions and aggregate them at different levels. We are going to use the Summarize tool to calculate the total sales for Coffee/Tea and group it by State, Product Line (tea/coffee), and Type (Decaf/Regular). Doing so, we are going to answer:
- Which state is the biggest consumer of regular coffee?
- Which state is the biggest consumer of decaf coffee?
- Which state is the biggest consumer of regular tea?
- Which state is the biggest consumer of decaf tea?
Let’s drag and drop the Summarize tool to the canvas and connect it to the Select tool. Once connected, we need to configure the Summarize tool. We need to Sum Sales and Aggregate the results to State, Product Line, and Type. From the Configuration Panel, we select the actions for each variable by clicking on the “+” sign.
All the actions added will show in the “Actions” area in the configuration tool. Notice that we do not need to run the workflow to see the results of our aggregations – this is a great feature that Designer Cloud offers to the users – BIG TIME SAVER when building workflows. We can also re-arrange or delete the order of the actions.
This far, we have calculated the total sales (Sum_sales) for each Product Line, Type, and State. The next step is to sort the States, Product Line, and Type based on Total Sales in descending order and assign a rank to the results. We can perform these actions using the Tile tool. Once the configuration of the Tile tool is done, we can see that there are two new columns added (Tile_Num and Tile_SequenceNum)
Next, we will remove, rename, and filter the results – to make them easier to read. To rename and un-select fields, we use Select. We will rename the Tile_SequenceNum to Total_Sales_Ranking and un-select the Tile_Num (unchecking it from the Select configuration tool panel). To filter just the top state (Total_Sales_Ranking = 1), we will use the Filter tool. The results will be in the “T” anchor (where the filter condition holds true)
We are going to export the partial results in a CSV file format on our local computer. (Read this post to learn more about how to Write a CSV file).
We still need to answer the following questions:
- What type of coffee drink is the most popular?
- What type of tea drink is the most popular?
To answer the last two questions, we need to calculate the total Sales for each product line and rank the results based on the total Sales.
We will start with the Summary tool and configure it to calculate the Sales Sum for each Product Line at the Product Type level.
To sort and rank the results, we will use a Tile tool and to rename and remove fields we will use the Select tool as follow:
We can output the results similarly as above; we are creating two CSV files that are going to use when creating the report. And to make this workflow clear to any user, we will add containers and comments to the process.
Results Visualization
You can access Reporting from the app switcher within the Platform. Once you are in the application, start by choosing from your library of imported datasets to begin building reports.
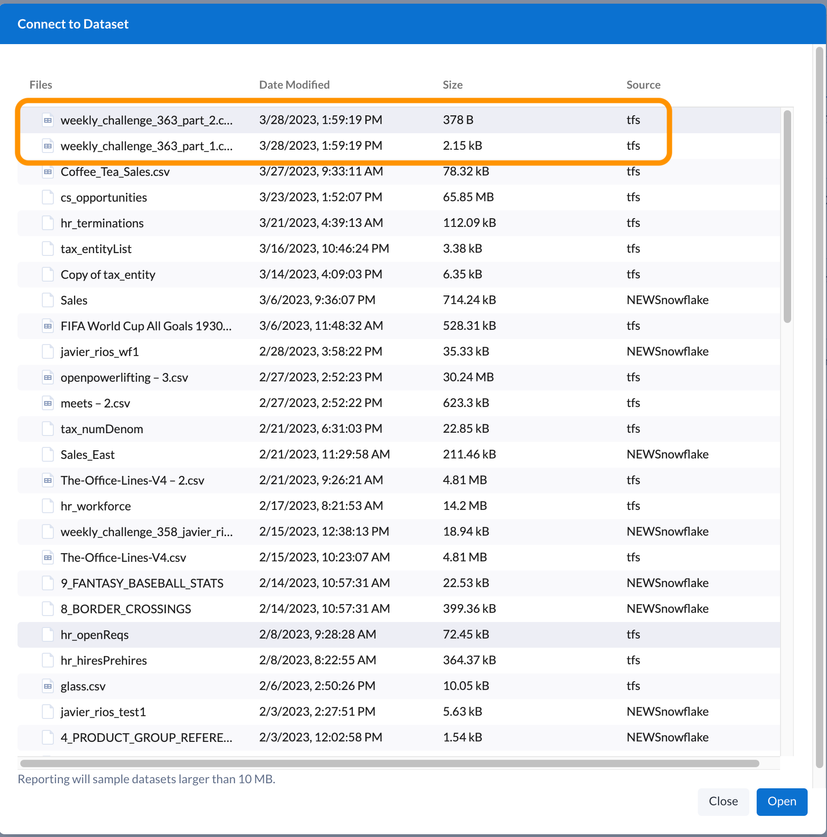
Let’s bring the results from the workflow we build. We need to import the CSV files from our computer to the Cloud and make them available for the Reporting Tool. Once the two outputs are available, we need to connect the Reporting tool to them.
We have created two different outputs using Designer Cloud, and now we are going to use them to create two reports.
|
Report 1 |
Report 2 |
|
Which state is the biggest consumer of regular coffee? Which state is the biggest consumer of decaf coffee? Which state is the biggest consumer of regular tea? Which state is the biggest consumer of decaf tea? |
What type of coffee drink is the most popular? What type of tea drink is the most popular?
|
To build reports, we will create the elements first and then use them into the canvas. Watch this video for more information.
Create and use elements
To create the Table element, we need to click on “+ Add” and then on Edit. Remember that the element will be populated with the data loaded.
Let’s rename the table, and de-select the fields we don’t need on the report.
Let’s create rules to customize the table. Column Rules allows you to create a rule for a specific column. In our example, we are going to search for the word “Coffee” in the product_line column, and once we find a cell with that content, we are going to change the background on that cell – the same for Tea.
Similarly, let’s add a Text element and edit it.
Once all the elements are created, we proceed to use them in the Report’s canvas area.
To edit the elements on the canvas, hover over it and click on the pen icon.
Editing the Layout
We add margins to the report to improve readability, and we can also change the report’s orientation.
Exporting the report
Finally, the results are in a PDF format – ready to be shared :)
You must be a registered user to add a comment. If you've already registered, sign in. Otherwise, register and sign in.


