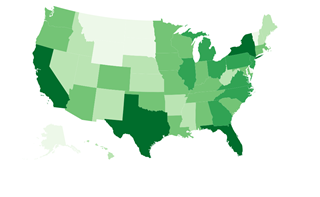
Continuing the series prototyping HTML based visualizations, I want to look at spatial data. One of the strengths of Alteryx is that spatial data is just data. It doesn’t claim to be a GIS product, it just assumes that every organization has spatial data and would like to process it with the rest of their data and specifically they don’t want to have to use multiple products to do it.
So far in my prototype I have ignored spatial data. Clearly if we decide to add new visualization features in Alteryx, spatial needs to be a 1st class part of it. Since this prototype is entirely based on HTML and JavaScript, we need to start with what spatial data looks like in that environment. Fortunately, there is already a standard for spatial data in JSON: GeoJSON.
If you have not yet read the other articles in this series, now might be the time to take a detour and catch up:
I have 2 goals to cover this week: Modify the JSONCreate macro from Part 1 to support GeoJSON and to create a quick prototype showing spatial data in HTML. In order to show the spatial data, I created a slightly modified version of the macro from Part 2.
Modifying the JSON Create Macro for GeoJSON
It is not a very well known feature, but if you use a Select tool in Alteryx and convert a spatial object to a V_String, the output will be GeoJSON. This is very helpful, but it does not solve the whole problem. While that makes each individual spatial object into JSON text, in order to do anything meaningful we need a single JSON document with all the objects combined into a geometry collection. In addition to this, we want to associate all the other data fields with each object in the GeoJSON. This is done by making a feature object which takes a collection of properties.
It is worth noting that by its nature, GeoJSON is effectively limited to a single spatial object per record. Alteryx is fairly unique in that it allows any number of spatial objects to be present on a single record, even of different types. Also, since the GeoJSON format starts with a spatial object, it can’t handle null or empty objects. This is probably OK for our purposes, since null objects would have no visual representation and that is the reason we are using GeoJSON in the 1st place. However, it does mean that GeoJSON would never be a good data interchange format (like YXDB could be if other people supported it).
Starting with the previous JSON Create macro, I created a new 4th option to output GeoJSON. This requires the picking of a singular spatial object field and will silently drop all the others. It leverages the same features previously covered in Part 1 to make all the fields into JSON, but this time puts them into the properties of the feature. In the end it wraps all the records into a feature collection array. I found a very handy site, http://geojsonlint.com/, that I could paste in my results to test and make sure I was building valid GeoJSON. It always helps to have a good test case when you are debugging something.
Putting it all together
So now that we have spatial data in our HTML, what do we do with it? It turns out that D3 has some very nice support for spatial objects. I found a nice book called Interactive Data Visualization for the Web that has some nice tutorials for using D3. They are very kind in that they give away a free copy of it for reading on the web, but I went ahead and bought a physical copy anyway, because its much easier flipping through a book while programming. Anyway, Chapter 12 has a nice getting started guide for building a map in HTML. You can see the results in the image above. Even though my map looks very similar to what they did in the book, all the data comes from Alteryx. I also always prefer a logarithmic scale for data on the map, so I went ahead and did that in the js code.
Clearly you can do much more with D3, including all kinds of interactivity, but in this case I wanted to keep it simple. In Part 3, I demonstrated how you can hack together interactive HTML outputs from Alteryx, and it would be easy to extend this example to be interactive.
Wrapping up
You can download the macros and test module here. In addition to a test module, this includes versions 2 of the JSONCreate macro from Part 1 and the html5render macro from Part 2 in order to support spatial objects.
Once again, thanks for reading,
Ned.
This post originally appeared at http://inspiringingenuity.net/2013/10/30/alteryx-geojson-data-output/
