The 7.1 release of Alteryx contains 17 new macros that enable data artisans to easily undertake predictive analytics projects. The tools can be placed into several different groups based on the business analytics functions they perform. The groups are predictive modeling, model assessment, grouping, data investigation, and data sampling for predictive analytics. This post is the second in a 5-part series will focus on the model assessment macros.
Model Assessment
The model assessment macros in Alteryx 7.1 allow a data artisan to both fine-tune a model under development, and determine which of several possible candidate models is most effective at predicting new data. The model assessment macros are:
 Nested Test
 Stepwise
 Lift Chart
The macros that help fine-tune the development of a predictive analytics model are focused on linear and logistic regression models, since decision tree and forest models do this implicitly. The Nested Test and Stepwise macros help the data artisan fine-tune a regression model with a large number of variables and reduce it down to the set of variables that are most important based on statistical criteria. The Nested Test macro does this in a selective fashion, in which a data artisan compares two models (one of which contains a subset of the predictor fields contained in the other) and determines whether the set of fields that are different between the two models can safely be removed. The Stepwise tool takes an initial regression model with a large number of predictor fields, and finds the best subset of those predictors using automated methods.
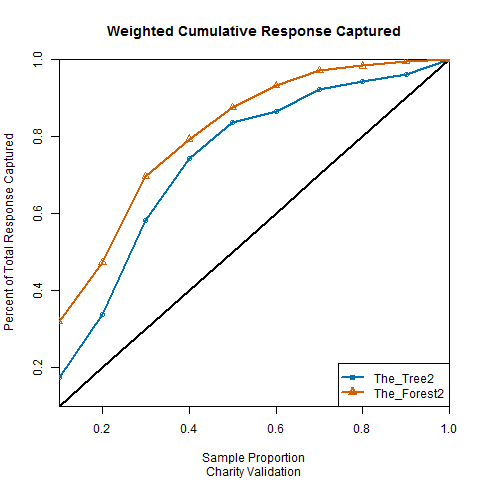 The Lift Chart tool allows a data artisan to compare the performance of different models, likely developed using different algorithms, on the metric that matters most, the ability to predict new data (i.e., data that was not used to create the models). In addition, lift chart tools allow a data artisan to quickly develop a high-level economic analysis of a proposed action.
In my next post, I will focus on the grouping macros which assist the data artisan in grouping both "units" (customers, outlets, transactions, etc.) and fields to form customer segments, grouping outlets together based on trade area characteristics in order to implement merchandising or pricing programs, or grouping transactions together to look for outliers that might signal fraudulent activity.