Data Science
Machine learning & data science for beginners and experts alike.- Community
- :
- Community
- :
- Learn
- :
- Blogs
- :
- Data Science
- :
- Data Science & Pop Music: Determining Song Sentime...
- Subscribe to RSS Feed
- Mark as New
- Mark as Read
- Bookmark
- Subscribe
- Printer Friendly Page
- Notify Moderator
Introduction
Do you ever feel “happy, free, confused and lonely at the same time?” Well, Taylor Swift does. (Or she did, at 22.)
There’s a lot of emotion in this song—some positive, some negative, and some neutral. And this got me thinking: can I determine the overall mood of her albums with data? With text mining and sentiment analysis, it turns out I can. And since Taylor Swift has written songs since she was 16, I can also look at how her songwriting sentiment has changed.
…Are you ready for it?
Data Pre-processing
I downloaded the lyrics data from Github. The data was structured with one record per lyric, labeled with the song and album. Additionally, each record has the previous and next lyrics in the song.
I brought this dataset into Alteryx Designer with an Input tool. I filtered out the singles and EPs in the data (since I wanted to look at the whole album sentiment) and joined in data on the album release dates.
The Text Pre-processing tool (in the Text Mining tab of the Intelligence Suite tools) took care of the data prep needed to generate word clouds, which I will discuss in more detail in the Visuals section. I selected English as the language and the Lyric field as the text to be processed.
Additionally, I filtered out stop words so the graphic would be informative and not show how often filler words like “and” occur in the lyrics. I learned from the tool documentation that the list of default stop words could be found here on Github. I added a few more stop words after seeing the “oh”s and “ah”s were included in the word clouds even after filtering out the default stop words.
Note: The true Taylor Swift fans out there know that recently Taylor has re-recorded and released some of her old songs as “Taylor’s Version” (so she owns the song rights). For this analysis, I only count one version of a given song since they have the same lyrics, and the release date is based on the original release, as that is when the song was first written.
Line by Line Sentiment Analysis
Since the data records were structured with one lyric per record, for my first analysis, I determined the sentiment of each lyric and then aggregated that score to get an average for each album.
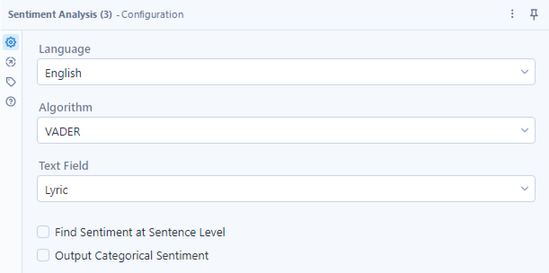
The Sentiment Analysis tool documentation indicated that it is best not to use the Text Pre-processing before sentiment analysis as it can remove some features that the tool uses to detect sentiment. So, I used the unprocessed data and configured the Sentiment Analysis tool like this:
Since the data is already at a “sentence” level, I left the sentence level option unchecked. Also, I wanted the sentiment score, not the category, to aggregate the outputs. So I left the second option unchecked as well.
Ok, so let’s look at the immediate output here:
You can see the sentiment score for each line broken out into negative, neutral, and positive. For each category, the score ranges from 0 to 1, with 0 being the least like that sentiment and 1 being the most. For example, the first record above scored mostly neutral with some positive sentiment. The compound score shows the overall sentiment of the field: -1 is the most negative score, 0 is the most neutral score, and 1 is the most positive score.
What caught my attention immediately here is that lyrics that are classified as neutral, like “can’t remember” or “to be double-crossed,” feel negative when put into the context of the rest of the verse: “Guess I’m feeling unmoored, can’t remember what I used to fight for. I rewind the tape, but all it does is pause on the very moment all was lost; sending signals to be double-crossed.” That feels pretty sad, but if we aggregate the compound sentiment scores for this song ("evermore"), it comes out to -0.11, indicating it is only slightly negative.
This is a lesson in sentiment analysis—sometimes you may want to analyze the sentence level, and other times you want to look at the body of text as a whole. You must determine which makes the most sense for your use case. And sometimes, it isn’t until you look at the results and compare them to your expectations that you realize a different analysis method is needed.
Given these observations, I decided to try analyzing at the song level next.
Song by Song Sentiment Analysis
I used a summarize tool to concatenate the lyrics for each song together. I then ran the field with the entire song text through the sentiment analysis tool to get the compound sentiment scores.
Results
The sentiment analysis at the song level gave a much more extensive range in the compound sentiment scores than the line level analysis. The summary statistics below are from the line-by-line analysis, aggregated at the album level: the sentiment ranges from .000032 (essentially neutral) to .082 (still very neutral).
This next set of statistics is from the song-by-song analysis, aggregated at the album level: the sentiment ranges from 0.13 to 0.71. Since the max sentiment score is 1, the song level analysis covers a broader range of the possible sentiment values.
Are you curious about the most and least positive albums? I was. Here are Taylor Swift’s full albums, ranked from most positive to most negative:
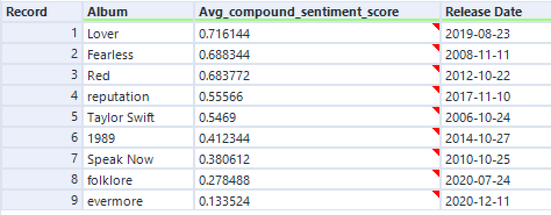
As an avid Taylor Swift listener, I was impressed with the ability of the text mining tools to detect the emotion in her songs correctly. I would categorize Lover, Fearless, Red, and 1989 as generally upbeat and positive. Reputation has a more angry tone, but it's not entirely negative. And the last two albums, folklore and evermore, have a sad and contemplative vibe throughout (along with being more acoustic and slow).
Some of her songs are poetic and contain figures of speech, double entendres, and other language subtleties. My hypothesis for the accurate sentiment scores is that the sentiment analysis tool is powerful and that Taylor Swift has enough songs on each album (and a consistent theme for each album) so that minor errors in language detection are inconsequential when aggregating scores for the whole album.
Outliers
Some notable song-level outliers were “Shake It Off” and "Sad, Beautiful, Tragic."
Taylor’s hit song “Shake It Off” scored a -0.999, a.k.a. as negative as it gets. I can see why negativity is detected here because she sings about lots of examples of people hating on her, and then her response is to “shake it off.” The instruments/composition sets the tone when you listen—it is very upbeat and pop-y. A total dance bop. But Alteryx can’t know this, and with the negative lyrics and the only (seemingly) positive sentiment being “just shake it off,” I can see why it got a negative score.
"Sad, Beautiful, Tragic" scored a 0.997—very positive—which surprised me, given the song's title and tone. The chorus mixes positive and negative emotions, with the lyric "What a sad, beautiful, tragic love there" repeated many times. It also has strictly positive lines, like "We had a beautiful magic love there." Perhaps the repetition of words such as beautiful, love, magic, and dreams throughout the song led the algorithm astray.
It's also worth noting that the sentiment analysis tool classified "This Is Why We Can't Have Nice Things" as positive, failing to pick up on the sarcastic tone of the entire song.
Visuals
Time for some fun data visuals—word clouds!
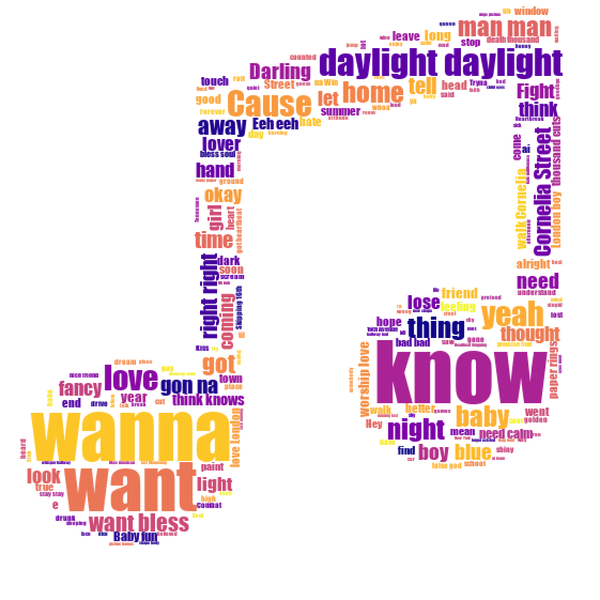
To create my first visual, I used the data coming out of the Text Pre-processing tool and filtered it down to the most positive album: Lover. Then, I pulled in a simple image of a music note with the image input to add a shape to the word cloud.
Here is the set-up of this portion of the workflow:
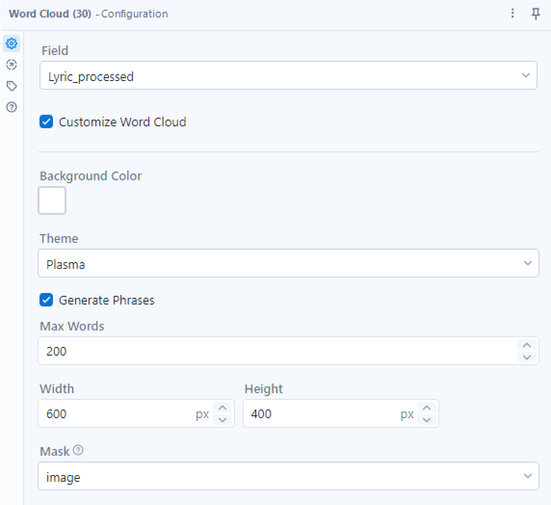
And below is the configuration of the word cloud tool. I customized the word cloud by selecting a color scheme and choosing the image I input as the mask (to customize the shape).
Below is the resulting world cloud, which can help with data validation. It allows me to see the most commonly used words in the Lover album, which gives me insight into why it was classified with positive sentiment.
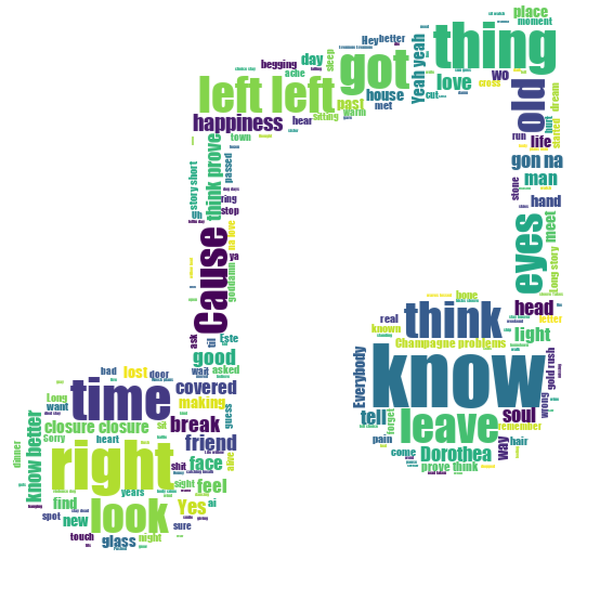
I repeated the same process as above with the lyrics from the most negative album—evermore. (I also chose a different color scheme.) Here is the resulting word cloud:
These visuals provide some insight into the sentiment scores for these albums, but they also remove all context, so they might not be the most helpful visuals for data like song lyrics.
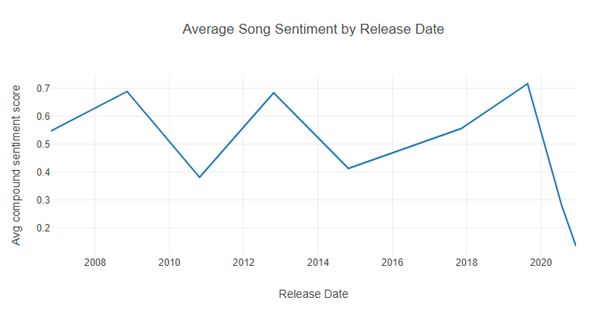
I made one final chart using the Interactive Chart tool to look at how Taylor’s average album sentiment has changed over time.
The graph shows that Taylor’s songs have gotten less positive over time... 2020 hit Taylor hard too, apparently.
Conclusion
This exercise showed me how powerful the text mining tools are with little configuration and how accurate the results can be. I made playlists for the top 20 most positive and negative songs—give them a listen to see how the sentiment analysis tool did!
I attached my workflow to this post if you want to try out a similar analysis. And, if you do not have the Intelligence Suite tools, you can download a free trial here to start playing around with text mining.

Sr. Content Manager
Hi, I'm Megan! I am a Sr. Content Manager at Alteryx. I work to make sure our blogs and podcast have high quality, helpful, and engaging content. If you want to create content for the Community, send me a DM and I can help you get started! I am very active on LinkedIn, so you can connect with me there as well.
Hi, I'm Megan! I am a Sr. Content Manager at Alteryx. I work to make sure our blogs and podcast have high quality, helpful, and engaging content. If you want to create content for the Community, send me a DM and I can help you get started! I am very active on LinkedIn, so you can connect with me there as well.
You must be a registered user to add a comment. If you've already registered, sign in. Otherwise, register and sign in.


