Alteryx Server Discussions
Find answers, ask questions, and share expertise about Alteryx Server.- Community
- :
- Community
- :
- Participate
- :
- Discussions
- :
- Server
- :
- Log Management of Alteryx Workflows in a multi-app...
Log Management of Alteryx Workflows in a multi-application setting in an Enterprise
- Subscribe to RSS Feed
- Mark Topic as New
- Mark Topic as Read
- Float this Topic for Current User
- Bookmark
- Subscribe
- Mute
- Printer Friendly Page
- Mark as New
- Bookmark
- Subscribe
- Mute
- Subscribe to RSS Feed
- Permalink
- Notify Moderator
logAlteryx Designer is a very popular client-side data wrangling tool for Data Scientists and engineers. It also has a server setup for collaboration and scheduling purposes in an enterprise setting. Once Alteryx gets integrated into the mix of other applications ( web, batch, etc.) then an interesting problem arises on how to keep track of data flow, failures, and log management.
Consider a scenario where a Java or Python-based application triggers Alteryx workflows on a server which in turn calls a REST API to persists the data. As you see there is an event or transaction that starts from an application in Java or Python, progresses through Alteryx workflows, and ends up invoking a REST API. There are many considerations as you develop this architecture in relation to the data and process flow through these disparate applications. Questions like the following need to be addressed:
- how to keep track of an event end-to-end
- correlate that event as it progresses through disparate systems
- in case of a failure, identify the data load and failure boundary
- Lastly how to log the events to enable the DevOps team to do a root cause analysis
Event Correlation: First consideration is the ability to correlate an event as it follows through these applications. A unique generated Id using one of the Math libraries can be utilized i.e. math.UUID(). In the case of multiple process flows, this UUID can be prefixed with the name of the process/application, see below:
CorrelationId = BalRepAlteryx+Math.UUID() =BalRepAlteryxf56eaf7f‑d8b4‑4aeb‑87a0‑dcbe059339ae
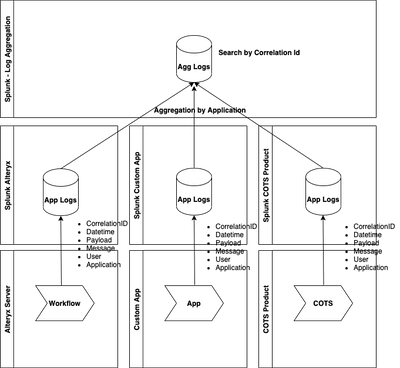
All the log messages across the applications can utilize this format while logging in to Splunk or any other log aggregators. The person doing the investigation can bring up all the messages in chronological order using this Correlation Id(UUID) to see a complete picture of what's going on across the applications.


Handshake: as the processing moves from different applications there is a need to do a proper handshake using logs so that in case of a failure or debugging it is easier to trace. Following are some of the attributes that should be logged on entry and exit :
- Correlation Id
- Date and Time
- Payload passed
- Custom Message
- Application/Function
Based on these attributes some of the following can be answered:
- Total execution time function
- process flow with payload
- how data got modified across applications
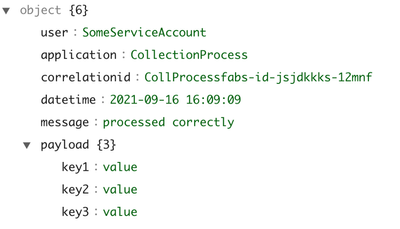
Sample Json data written in logs would look like :


DevOps team can create a consolidated view over multiple Splunk indices for the applications in scope and it can be used to see the event progression end-to-end identified by a correlationId.In this way, Alteryx can be embedded in the overall fabric of existing enterprise applications.
-
Administration
1 -
Alias Manager
28 -
Alteryx Designer
1 -
Alteryx Editions
3 -
AMP Engine
38 -
API
385 -
App Builder
18 -
Apps
298 -
Automating
1 -
Batch Macro
58 -
Best Practices
317 -
Bug
96 -
Chained App
96 -
Common Use Cases
131 -
Community
1 -
Connectors
157 -
Database Connection
336 -
Datasets
73 -
Developer
1 -
Developer Tools
133 -
Documentation
118 -
Download
96 -
Dynamic Processing
89 -
Email
81 -
Engine
42 -
Enterprise (Edition)
1 -
Error Message
415 -
Events
48 -
Gallery
1,419 -
In Database
73 -
Input
180 -
Installation
140 -
Interface Tools
180 -
Join
15 -
Licensing
71 -
Macros
149 -
Marketplace
4 -
MongoDB
262 -
Optimization
62 -
Output
273 -
Preparation
1 -
Publish
199 -
R Tool
20 -
Reporting
99 -
Resource
2 -
Run As
64 -
Run Command
102 -
Salesforce
35 -
Schedule
258 -
Scheduler
357 -
Search Feedback
1 -
Server
2,200 -
Settings
541 -
Setup & Configuration
1 -
Sharepoint
85 -
Spatial Analysis
14 -
Tableau
71 -
Tips and Tricks
232 -
Topic of Interest
49 -
Transformation
1 -
Updates
90 -
Upgrades
197 -
Workflow
600
- « Previous
- Next »