Alteryx Machine Learning Discussions
Find answers, ask questions, and share expertise about Alteryx Machine Learning.Getting Started
Start your learning journey with Alteryx Machine Learning Interactive Lessons
Go to Lessons- Community
- :
- Community
- :
- Participate
- :
- Discussions
- :
- Machine Learning
- :
- Visualize clusters with centroids using Alteryx wi...
Visualize clusters with centroids using Alteryx with Longitude and Latitude values
- Subscribe to RSS Feed
- Mark Topic as New
- Mark Topic as Read
- Float this Topic for Current User
- Bookmark
- Subscribe
- Mute
- Printer Friendly Page
- Mark as New
- Bookmark
- Subscribe
- Mute
- Subscribe to RSS Feed
- Permalink
- Notify Moderator
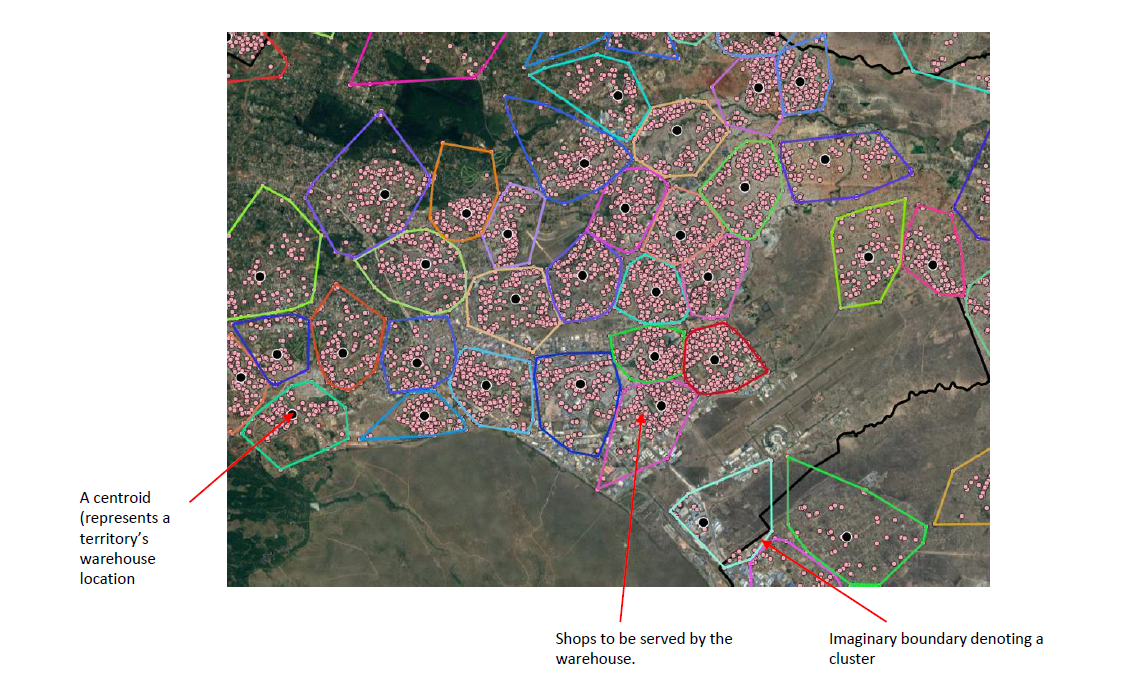
I need help to Plot the data submission_file_centroids.csv on the map as per attached sample cluster screenshot.
- You are only required to address clustering shops (customer_id) around the fulfilment centers.
- See attached dataset submission_file_centroids.csv that has the column details.
P.s the longitude and latitude values are for KENYA
A centroid (represents a territory’swarehouse location)
Solved! Go to Solution.
- Labels:
-
Question
-
Use Case Support

- Mark as New
- Bookmark
- Subscribe
- Mute
- Subscribe to RSS Feed
- Permalink
- Notify Moderator
So for each Warehouse, you need to create a cluster/spatial object around all of the customers that it supports? Is this accurate?
- Mark as New
- Bookmark
- Subscribe
- Mute
- Subscribe to RSS Feed
- Permalink
- Notify Moderator
@KSowers that is correct!
- Mark as New
- Bookmark
- Subscribe
- Mute
- Subscribe to RSS Feed
- Permalink
- Notify Moderator
- Mark as New
- Bookmark
- Subscribe
- Mute
- Subscribe to RSS Feed
- Permalink
- Notify Moderator
@KSowers thanks, though am unable to open the Workflow you've shared i keep getting below error message
This workflow was created by a more recent version of Alteryx, and may contain tools or functionality not present in this version. Alteryx does not support using an earlier version of Alteryx to open a workflow created with a newer version. For best results, download the latest version of Alteryx.
- Mark as New
- Bookmark
- Subscribe
- Mute
- Subscribe to RSS Feed
- Permalink
- Notify Moderator
Right click and open as a notepad, change the highlighted text in the image to be the version that you have of Designer and resave as a .yxmd file:

- Mark as New
- Bookmark
- Subscribe
- Mute
- Subscribe to RSS Feed
- Permalink
- Notify Moderator

- Mark as New
- Bookmark
- Subscribe
- Mute
- Subscribe to RSS Feed
- Permalink
- Notify Moderator
In the meantime are you able to save/share as a .yxmd file ?
- Mark as New
- Bookmark
- Subscribe
- Mute
- Subscribe to RSS Feed
- Permalink
- Notify Moderator
That's the zip file, unzip it first with Alteryx (If it lets you) and try to open the .yxmd as a notepad, not the .yxzp.
- Mark as New
- Bookmark
- Subscribe
- Mute
- Subscribe to RSS Feed
- Permalink
- Notify Moderator
Still not opening, are you able to share a screenshot of the workflow itself?
-
Academy
1 -
App Builder
3 -
Bugs & Issues
24 -
Data
22 -
Enhancement
10 -
General Feedback
21 -
Marketplace
1 -
Question
69 -
Resource
24 -
Use Case Support
36