The Alteryx Community is a finalist in three 2026 CMX Awards! Help us win Customer Support Community, Most Engaged Community, and User Group Program of the Year - vote now! (it only takes about 2 minutes) before January 9.
ACT NOW: The Alteryx team will be retiring support for Community account recovery and Community email-change requests Early 2026. Make sure to check your account preferences in my.alteryx.com to make sure you have filled out your security questions.
Learn more here
Search
Close
Start Free Trial
Turn on suggestions
Auto-suggest helps you quickly narrow down your search results by suggesting possible matches as you type.
Showing results for
Alteryx Machine Learning Discussions
Find answers, ask questions, and share expertise about Alteryx Machine Learning.Getting Started
Start your learning journey with Alteryx Machine Learning Interactive Lessons
Go to Lessons- Community
- :
- Community
- :
- Participate
- :
- Discussions
- :
- Machine Learning
- :
- Re: Visualize clusters with centroids using Altery...
SOLVED
Visualize clusters with centroids using Alteryx with Longitude and Latitude values
Options
- Subscribe to RSS Feed
- Mark Topic as New
- Mark Topic as Read
- Float this Topic for Current User
- Bookmark
- Subscribe
- Mute
- Printer Friendly Page
mboroto_89
8 - Asteroid
12-20-2022
07:04 AM
- Mark as New
- Bookmark
- Subscribe
- Mute
- Subscribe to RSS Feed
- Permalink
- Notify Moderator
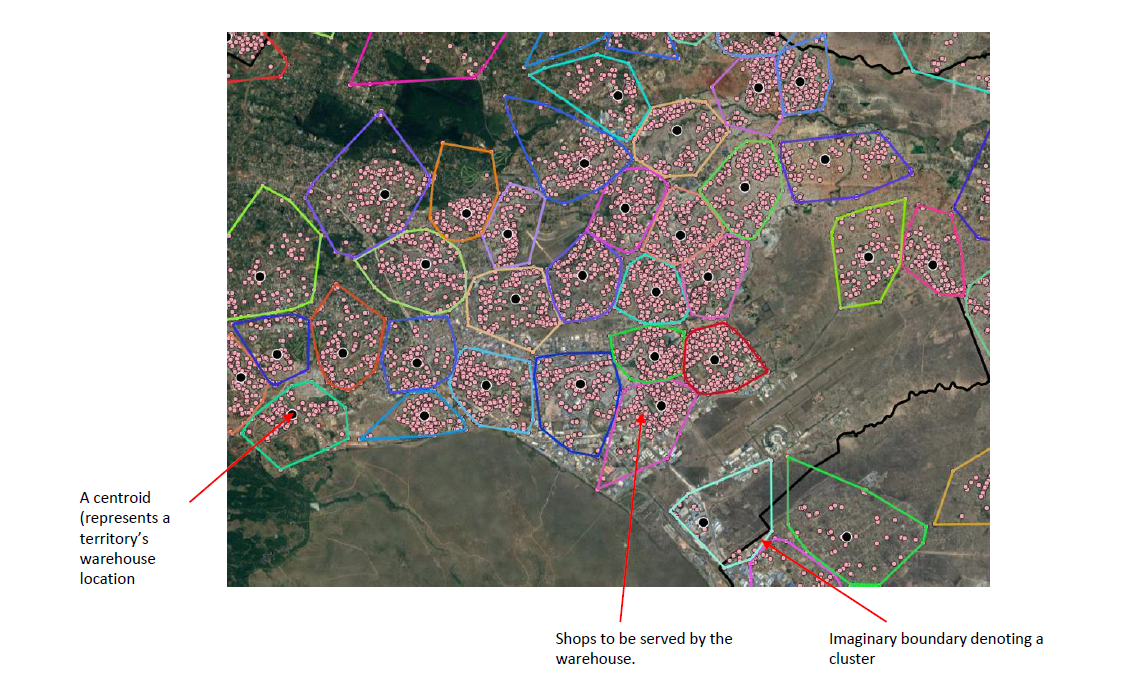
I need help to Plot the data submission_file_centroids.csv on the map as per attached sample cluster screenshot.
- You are only required to address clustering shops (customer_id) around the fulfilment centers.
- See attached dataset submission_file_centroids.csv that has the column details.
P.s the longitude and latitude values are for KENYA
A centroid (represents a territory’swarehouse location)
Solved! Go to Solution.
Labels:
- Labels:
-
Question
-
Use Case Support

14 REPLIES 14
Alteryx
12-23-2022
01:10 PM
- Mark as New
- Bookmark
- Subscribe
- Mute
- Subscribe to RSS Feed
- Permalink
- Notify Moderator
Alteryx
12-23-2022
01:12 PM
- Mark as New
- Bookmark
- Subscribe
- Mute
- Subscribe to RSS Feed
- Permalink
- Notify Moderator
12-23-2022
01:51 PM
- Mark as New
- Bookmark
- Subscribe
- Mute
- Subscribe to RSS Feed
- Permalink
- Notify Moderator
Many thanks @KSowers this will work
Alteryx
12-24-2022
06:11 AM
- Mark as New
- Bookmark
- Subscribe
- Mute
- Subscribe to RSS Feed
- Permalink
- Notify Moderator
Awesome!
01-12-2023
06:45 AM
- Mark as New
- Bookmark
- Subscribe
- Mute
- Subscribe to RSS Feed
- Permalink
- Notify Moderator
- « Previous
-
- 1
- 2
- Next »
Labels
-
Academy
1 -
App Builder
3 -
Bugs & Issues
24 -
Data
22 -
Enhancement
10 -
General Feedback
21 -
Marketplace
1 -
Question
69 -
Resource
24 -
Use Case Support
36