Alteryx Designer Desktop Discussions
Find answers, ask questions, and share expertise about Alteryx Designer Desktop and Intelligence Suite.- Community
- :
- Community
- :
- Participate
- :
- Discussions
- :
- Designer Desktop
- :
- Network Map
Network Map
- Subscribe to RSS Feed
- Mark Topic as New
- Mark Topic as Read
- Float this Topic for Current User
- Bookmark
- Subscribe
- Mute
- Printer Friendly Page
- Mark as New
- Bookmark
- Subscribe
- Mute
- Subscribe to RSS Feed
- Permalink
- Notify Moderator
Hi!
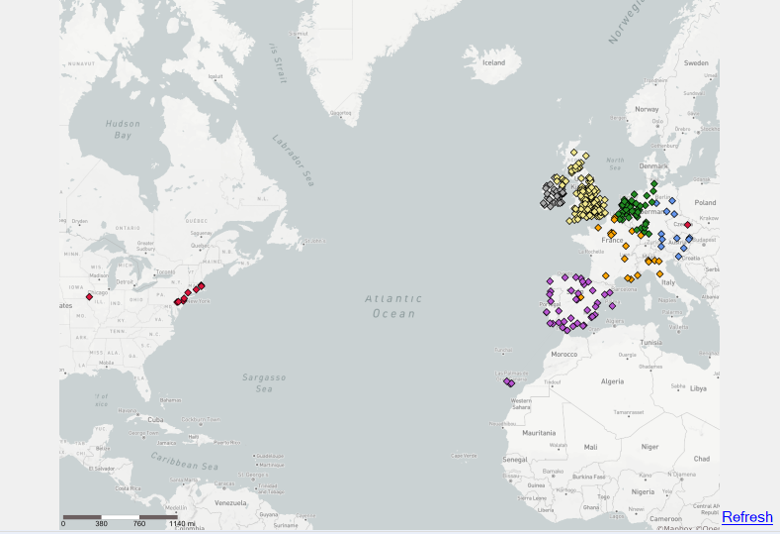
I need to build a network distribution map (example attached). I have an excel file with stores and another for all the distribution centers that serve the stores. The idea is to map all the distribution centers with their corresponding stores in a map. I've tried a couple of things found on the forum but with no luck.
Any help would be greatly appreciated!
Solved! Go to Solution.
- Labels:
-
Help
-
Reporting
-
Tips and Tricks

- Mark as New
- Bookmark
- Subscribe
- Mute
- Subscribe to RSS Feed
- Permalink
- Notify Moderator
Hi @Fco_Garcia
This is very possible in Alteryx! I have a few questions to start with to make sure we have the data we need:
- Do you have spatial data on the location of each distribution center and store? This could be latitude/longitude values, or spatial objects like centroids or polygons?
- Can you Join your distribution and store lists together?
- Could you share some screenshots of your data so we know what your fields look like?
I'm sure the Community can help you, we just need to know where we begin.
- Mark as New
- Bookmark
- Subscribe
- Mute
- Subscribe to RSS Feed
- Permalink
- Notify Moderator
Hi Charlie!
To answer your questions:
- I have addresses, but can get the latitude/longitude values from it
- Yes I can join both together - right now the lists are connected by the distribution center(s) that serves that store
* Store list example:
| DC | Country | City | Full address |
| DC1 | COUNTRY 1 | CITY 1 | XXX STREET |
| DC2 | COUNTRY 1 | CITY 2 | YYY STREET |
* Distribution center list:
| DC | DC Country | DC City | DC address line | DC postcode |
| DC1 | COUNTRY 1 | CITY 1 & CITY 2 | XYX STREET | 111 111 |
* Important to consider that store can be served by more than 1 DC
Thanks!
- Mark as New
- Bookmark
- Subscribe
- Mute
- Subscribe to RSS Feed
- Permalink
- Notify Moderator
Hi @Fco_Garcia,
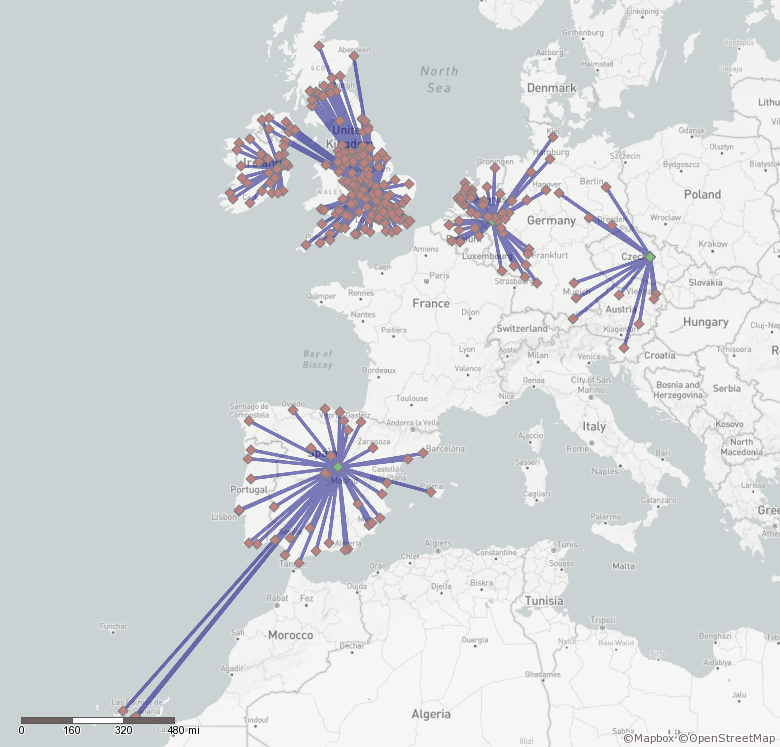
To create your map you'd need the longitude and latitude, as you said you can get hold of them i've used some dummy locations! Is this what you're looking to achieve?

If this solves your issue please mark the answer as correct, if not let me know! I've attached my workflow for you to download if needed.
Regards,
Jonathan
- Mark as New
- Bookmark
- Subscribe
- Mute
- Subscribe to RSS Feed
- Permalink
- Notify Moderator
Hi @Fco_Garcia,
You could also output the map to a PDF for example with the use of report map and render tools:

Which could generate you a PDF like this (also attached):

If this solves your issue please mark the answer as correct, if not let me know! I've attached an updated workflow for you to download if needed.
Regards,
Jonathan
- Mark as New
- Bookmark
- Subscribe
- Mute
- Subscribe to RSS Feed
- Permalink
- Notify Moderator
@Fco_Garcia Thanks for that information.
Let's assume that you append the latitude/longitude information to each store and DC record; now we're ready to get started! @Jonathan-Sherman has a great suggest to Join the records together and use the ST_CreateLine( function to draw the connecting line (I did the same thing).
The next steps I take show you how to create a stylized map of these objects using the Report Map tool (plus a trick on the lines).
- The easiest way to get started with the Report Map tool is to connect multiple inputs, one for each item you would like to display. In this case, I have 3 inputs: Stores, DCs, and the lines between. An important note: all three of these input have a [DC] field which we'll use later.
- Before we start configuring our Report Map tool, here's some useful information: you can't apply thematic colors to a line, only points and polygons. What do we do? convert our lines into polygons by drawing a small buffer around it using the Buffer tool.
- Now everything is going into the Report Map tool like we need. The important settings here are under the "Data" tab, set the "Thematic" field for all your inputs to [DC]. This will give us a common field to color coordinate with.
- When we add each of the 3 spatial objects to our map (DC, Stores, Lines), there is a "Theme" option that we can set to "Unique Value" and "Map". This will map each of the unique DC field values to a unique color.

Check out the attached example to see an example of all this in action.
- Mark as New
- Bookmark
- Subscribe
- Mute
- Subscribe to RSS Feed
- Permalink
- Notify Moderator


-
Academy
6 -
ADAPT
2 -
Adobe
203 -
Advent of Code
3 -
Alias Manager
77 -
Alteryx Copilot
24 -
Alteryx Designer
7 -
Alteryx Editions
89 -
Alteryx Practice
20 -
Amazon S3
149 -
AMP Engine
250 -
Announcement
1 -
API
1,206 -
App Builder
116 -
Apps
1,358 -
Assets | Wealth Management
1 -
Basic Creator
14 -
Batch Macro
1,551 -
Behavior Analysis
245 -
Best Practices
2,690 -
Bug
719 -
Bugs & Issues
1 -
Calgary
67 -
CASS
53 -
Chained App
267 -
Common Use Cases
3,819 -
Community
26 -
Computer Vision
85 -
Connectors
1,424 -
Conversation Starter
3 -
COVID-19
1 -
Custom Formula Function
1 -
Custom Tools
1,934 -
Data
1 -
Data Challenge
10 -
Data Investigation
3,484 -
Data Science
3 -
Database Connection
2,215 -
Datasets
5,215 -
Date Time
3,226 -
Demographic Analysis
186 -
Designer Cloud
737 -
Developer
4,359 -
Developer Tools
3,525 -
Documentation
526 -
Download
1,036 -
Dynamic Processing
2,933 -
Email
926 -
Engine
145 -
Enterprise (Edition)
1 -
Error Message
2,253 -
Events
196 -
Expression
1,867 -
Financial Services
1 -
Full Creator
2 -
Fun
2 -
Fuzzy Match
711 -
Gallery
666 -
GenAI Tools
2 -
General
2 -
Google Analytics
155 -
Help
4,703 -
In Database
965 -
Input
4,288 -
Installation
359 -
Interface Tools
1,898 -
Iterative Macro
1,090 -
Join
1,955 -
Licensing
251 -
Location Optimizer
60 -
Machine Learning
259 -
Macros
2,857 -
Marketo
12 -
Marketplace
23 -
MongoDB
82 -
Off-Topic
5 -
Optimization
750 -
Output
5,241 -
Parse
2,325 -
Power BI
227 -
Predictive Analysis
936 -
Preparation
5,159 -
Prescriptive Analytics
205 -
Professional (Edition)
4 -
Publish
257 -
Python
851 -
Qlik
39 -
Question
1 -
Questions
2 -
R Tool
476 -
Regex
2,339 -
Reporting
2,428 -
Resource
1 -
Run Command
572 -
Salesforce
276 -
Scheduler
410 -
Search Feedback
3 -
Server
628 -
Settings
932 -
Setup & Configuration
3 -
Sharepoint
624 -
Spatial Analysis
599 -
Starter (Edition)
1 -
Tableau
512 -
Tax & Audit
1 -
Text Mining
468 -
Thursday Thought
4 -
Time Series
430 -
Tips and Tricks
4,182 -
Topic of Interest
1,124 -
Transformation
3,720 -
Twitter
23 -
Udacity
84 -
Updates
1 -
Viewer
3 -
Workflow
9,960
- « Previous
- Next »