Alteryx Designer Desktop Discussions
Find answers, ask questions, and share expertise about Alteryx Designer Desktop and Intelligence Suite.- Community
- :
- Community
- :
- Participate
- :
- Discussions
- :
- Designer Desktop
- :
- Interactive Chart with Missing Layer
Interactive Chart with Missing Layer
- Subscribe to RSS Feed
- Mark Topic as New
- Mark Topic as Read
- Float this Topic for Current User
- Bookmark
- Subscribe
- Mute
- Printer Friendly Page
- Mark as New
- Bookmark
- Subscribe
- Mute
- Subscribe to RSS Feed
- Permalink
- Notify Moderator
I am currently working on a report using the interactive chart where sometimes a layer might not be present for a certain input. I would input an account name and the report that is returned to me will tell me the amount of data month to month that the account has transferred. It is a bar graph with two layers "inbound" and "outbound", but sometimes any given account will only have data transferred in one direction. If this occurs, after summarizing and crosstab-ing the data the column is missing so the chart will not render (The field "XXX" is not contained in the record). Is there any way to change this so that if data is missing it just counts the value as 0 and renders the chart? Ironically when I go to configure chart it looks correct (shows the data that is there) and I would like this to populate to the report even though the second layer is missing.
If there is not a way to do it in the interactive chart options itself, is there some way to work around it and have my workflow check for the columns and if one is missing add it with a 0 value?
Thanks!
Solved! Go to Solution.
- Labels:
-
Reporting
- Mark as New
- Bookmark
- Subscribe
- Mute
- Subscribe to RSS Feed
- Permalink
- Notify Moderator
Hi @barnese ,
That's a really interesting question and the only workaround I could think of is the one you suggested, but I'm keen to see if there is a more dynamic way of solving this.
Essentially I used a "Field Info" tool to get the field names of my dataset and check if Outbound is contained in one of them. If not, I would create a column called "Outbound" and feed that to a separate Interactive chart tool
Not sure if that would work in your instance because I've mocked up this dataset. To see how the workflow will react if Outbound column is contained/not contained in the dataset, just alter the connection in the field info tool. For your case, you would only have one stream going in.
Let me know if that worked for you.
Regards,
Angelos
- Mark as New
- Bookmark
- Subscribe
- Mute
- Subscribe to RSS Feed
- Permalink
- Notify Moderator
Here's an easy way to ensure that field(s) exists in your output
Simply add a Text Input tool with the correct column name(s) and no rows. Use a Select to set the correct field types for each of the defined columns and union this with your incoming data. Any fields missing from the input will be populated with null() values. After this, it's up to you if you want change the nulls to 0 or leave them as null. The Formula tool just passes through the null values but also includes a commented formula to replace nulls with 0
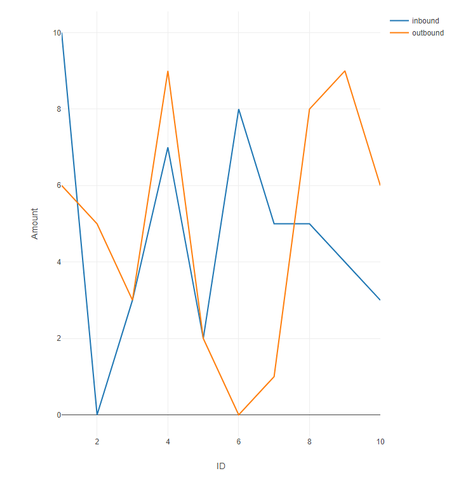
With both columns in the input the result is this
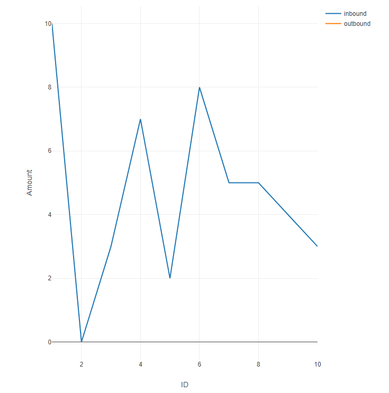
With the outbound column missing you get this
If you choose to replace the null column with zeros, you'll end up with an orange line at Y=0. I prefer to not have the line at all, because it shows that the outbound information was missing from the input. With the 0 line there, you have to investigate to see if the data is missing or if it really is all 0
Dan
- Mark as New
- Bookmark
- Subscribe
- Mute
- Subscribe to RSS Feed
- Permalink
- Notify Moderator
Thank you!! Works perfectly!
-
Academy
6 -
ADAPT
2 -
Adobe
204 -
Advent of Code
3 -
Alias Manager
78 -
Alteryx Copilot
26 -
Alteryx Designer
7 -
Alteryx Editions
95 -
Alteryx Practice
20 -
Amazon S3
149 -
AMP Engine
252 -
Announcement
1 -
API
1,210 -
App Builder
116 -
Apps
1,360 -
Assets | Wealth Management
1 -
Basic Creator
15 -
Batch Macro
1,559 -
Behavior Analysis
246 -
Best Practices
2,696 -
Bug
720 -
Bugs & Issues
1 -
Calgary
67 -
CASS
53 -
Chained App
268 -
Common Use Cases
3,825 -
Community
26 -
Computer Vision
86 -
Connectors
1,426 -
Conversation Starter
3 -
COVID-19
1 -
Custom Formula Function
1 -
Custom Tools
1,939 -
Data
1 -
Data Challenge
10 -
Data Investigation
3,489 -
Data Science
3 -
Database Connection
2,221 -
Datasets
5,223 -
Date Time
3,229 -
Demographic Analysis
186 -
Designer Cloud
743 -
Developer
4,376 -
Developer Tools
3,534 -
Documentation
528 -
Download
1,038 -
Dynamic Processing
2,941 -
Email
929 -
Engine
145 -
Enterprise (Edition)
1 -
Error Message
2,262 -
Events
198 -
Expression
1,868 -
Financial Services
1 -
Full Creator
2 -
Fun
2 -
Fuzzy Match
714 -
Gallery
666 -
GenAI Tools
3 -
General
2 -
Google Analytics
155 -
Help
4,711 -
In Database
966 -
Input
4,296 -
Installation
361 -
Interface Tools
1,902 -
Iterative Macro
1,095 -
Join
1,960 -
Licensing
252 -
Location Optimizer
60 -
Machine Learning
260 -
Macros
2,866 -
Marketo
12 -
Marketplace
23 -
MongoDB
82 -
Off-Topic
5 -
Optimization
751 -
Output
5,259 -
Parse
2,328 -
Power BI
228 -
Predictive Analysis
937 -
Preparation
5,171 -
Prescriptive Analytics
206 -
Professional (Edition)
4 -
Publish
257 -
Python
855 -
Qlik
39 -
Question
1 -
Questions
2 -
R Tool
476 -
Regex
2,339 -
Reporting
2,434 -
Resource
1 -
Run Command
576 -
Salesforce
277 -
Scheduler
411 -
Search Feedback
3 -
Server
631 -
Settings
936 -
Setup & Configuration
3 -
Sharepoint
628 -
Spatial Analysis
599 -
Starter (Edition)
1 -
Tableau
512 -
Tax & Audit
1 -
Text Mining
468 -
Thursday Thought
4 -
Time Series
432 -
Tips and Tricks
4,187 -
Topic of Interest
1,126 -
Transformation
3,732 -
Twitter
23 -
Udacity
84 -
Updates
1 -
Viewer
3 -
Workflow
9,983
- « Previous
- Next »


