Alteryx Designer Desktop Discussions
Find answers, ask questions, and share expertise about Alteryx Designer Desktop and Intelligence Suite.- Community
- :
- Community
- :
- Participate
- :
- Discussions
- :
- Designer Desktop
- :
- Re: How to make multiple line items into a single ...
How to make multiple line items into a single line item?
- Subscribe to RSS Feed
- Mark Topic as New
- Mark Topic as Read
- Float this Topic for Current User
- Bookmark
- Subscribe
- Mute
- Printer Friendly Page
- Mark as New
- Bookmark
- Subscribe
- Mute
- Subscribe to RSS Feed
- Permalink
- Notify Moderator
Hi,
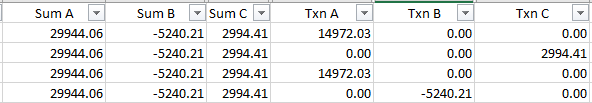
In my attached screenshot, I am getting 4 line items for a single account. The txn colums are the individual txns comprising the sum columns. How do I make it like this?
Sum A Sum B Sum C Txn A Txn B Txn C
29944.06 -5240.21 2994.41 14972.03 -5240.21 2994.41
29944.06 -5240.21 2994.41 14972.03 0 0
Or something like that. Basically, I need to delete duplicate rows as much as possible. Some accounts have 72 line items but most are just duplicate lines.
Thank you!
Solved! Go to Solution.
- Labels:
-
Best Practices

- Mark as New
- Bookmark
- Subscribe
- Mute
- Subscribe to RSS Feed
- Permalink
- Notify Moderator
I think you just want to use a Unique tool with all the fields selected.
It would be beneficial to see more of the data set but based on your question, this seems to be all you need to do.
Thanks, let me know if this works!
- Mark as New
- Bookmark
- Subscribe
- Mute
- Subscribe to RSS Feed
- Permalink
- Notify Moderator
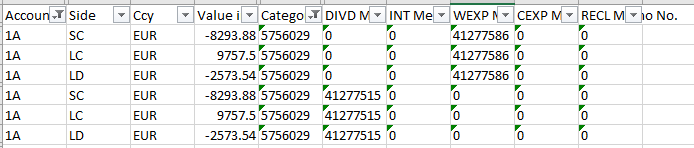
Hi @Blake ,
I am using a Unique tool in my workflow. I actually tried different fields combinations to fix this but no luck. I've attached another sample. Ideally, I should only have 3 lines if columns 6 & 8 are aligned.
Thank you,
crazybeauti_ful
- Mark as New
- Bookmark
- Subscribe
- Mute
- Subscribe to RSS Feed
- Permalink
- Notify Moderator
Hi,
I suspect you will have to first combine column 6 and 8 then dedup based on this column.
It will be really helpful if you can attach a sample of the data instead.
Cheers,
Seinchyi
- Mark as New
- Bookmark
- Subscribe
- Mute
- Subscribe to RSS Feed
- Permalink
- Notify Moderator
Take a look at the crosstab tool. You specify which columns tell you that you have a unique row, and how to summarize the other information on the line.
- Mark as New
- Bookmark
- Subscribe
- Mute
- Subscribe to RSS Feed
- Permalink
- Notify Moderator
hi all,
I've attached more samples for my dilemma but here's a quick look:
Current State:
| Name | Date 1 | Code | Date 2 | Amount 1 | Amount 2 | Lookup |
| A1 | 2020-04-02 | B1 | 2020-05-04 | 2237.02 | 0.00 | A1B12020-04-022020-05-04 |
| A1 | 2020-04-02 | B1 | 2020-05-04 | 0.00 | -559.25 | A1B12020-04-022020-05-04 |
| A1 | 2020-04-02 | B2 | 2020-05-04 | 7448.94 | 0.00 | A1B22020-04-022020-05-04 |
| A1 | 2020-04-02 | B2 | 2020-05-04 | 0.00 | -1862.23 | A1B22020-04-022020-05-04 |
Expectation:
| Date 1 | Code | Date 2 | Amount 1 | Amount 2 | Lookup |
| 2020-04-02 | B1 | 2020-05-04 | 2237.02 | -559.25 | A1B12020-04-022020-05-04 |
| 2020-04-02 | B2 | 2020-05-04 | 7448.94 | -1862.23 | A1B22020-04-022020-05-04 |
I'd really appreciate all your helping hands!
Thank you.
- Mark as New
- Bookmark
- Subscribe
- Mute
- Subscribe to RSS Feed
- Permalink
- Notify Moderator
@crazybeauti_fulWhy don't you summarize
- Mark as New
- Bookmark
- Subscribe
- Mute
- Subscribe to RSS Feed
- Permalink
- Notify Moderator
Hi @deviseetharaman ,
I think summarize can work per my initial test. I used max and min to do it but this is only assuming it only 2 transactions. How can I include all transactions if there are more than 2?
Thank you!
- Mark as New
- Bookmark
- Subscribe
- Mute
- Subscribe to RSS Feed
- Permalink
- Notify Moderator
@crazybeauti_fulcould you please test the attached WF
- Mark as New
- Bookmark
- Subscribe
- Mute
- Subscribe to RSS Feed
- Permalink
- Notify Moderator
Hi @deviseetharaman ,
I think I'm getting there (thank you!!!) but I have one last question (sorry!!).
My actual data looks like this. I need 2 columns for each Desc --
1. total
2. individual amounts
I've got the total column correctly but I had trouble on the individual amounts because they are not lined up correctly (multiple rows attachment earlier). Your workflow will work if I only have max of 2 amounts per Desc but how do I do it if I have > 2 amounts like in the expectation table?
Super thank you!!!
Current State:
| Name | Date 1 | Amount | Code | Date 2 | Desc | Lookup |
| A1 | 20200519 | 1681.59 | B1 | 20200521 | D | A1B12020051920200521 |
| A1 | 20200519 | -420.4 | B1 | 20200521 | T | A1B12020051920200521 |
| A1 | 20200519 | 252.24 | B1 | 20200521 | R | A1B12020051920200521 |
| A1 | 20200519 | 2555.69 | B1 | 20200521 | D | A1B12020051920200521 |
| A1 | 20200519 | -894.49 | B1 | 20200521 | T | A1B12020051920200521 |
| A1 | 20200519 | 638.92 | B1 | 20200521 | R | A1B12020051920200521 |
| A1 | 20200519 | 800 | B1 | 20200521 | D | A1B12020051920200521 |
| A1 | 20200519 | 500 | B1 | 20200521 | D | A1B12020051920200521 |
| A1 | 20200519 | 200 | B1 | 20200521 | T | A1B12020051920200521 |
Expectation:
| Name | Date 1 | Code | Date 2 | Lookup | D_Sum | D | T_Sum | T | R_Sum | R |
| A1 | 20200519 | B1 | 20200521 | A1B12020051920200521 | 5537.28 | 1681.59 | -1514.89 | -420.4 | 891.16 | 252.24 |
| A1 | 20200519 | B1 | 20200521 | A1B12020051920200521 | 5537.28 | 2555.69 | -1514.89 | -894.49 | 891.16 | 638.92 |
| A1 | 20200519 | B1 | 20200521 | A1B12020051920200521 | 5537.28 | 500 | -1514.89 | -200 | 891.16 | 0 |
| A1 | 20200519 | B1 | 20200521 | A1B12020051920200521 | 5537.28 | 800 | -1514.89 | 0 | 891.16 | 0 |

-
Academy
6 -
ADAPT
2 -
Adobe
203 -
Advent of Code
3 -
Alias Manager
77 -
Alteryx Copilot
23 -
Alteryx Designer
7 -
Alteryx Editions
81 -
Alteryx Practice
20 -
Amazon S3
149 -
AMP Engine
250 -
Announcement
1 -
API
1,205 -
App Builder
115 -
Apps
1,358 -
Assets | Wealth Management
1 -
Basic Creator
13 -
Batch Macro
1,547 -
Behavior Analysis
244 -
Best Practices
2,689 -
Bug
719 -
Bugs & Issues
1 -
Calgary
67 -
CASS
53 -
Chained App
267 -
Common Use Cases
3,815 -
Community
26 -
Computer Vision
85 -
Connectors
1,422 -
Conversation Starter
3 -
COVID-19
1 -
Custom Formula Function
1 -
Custom Tools
1,933 -
Data
1 -
Data Challenge
10 -
Data Investigation
3,483 -
Data Science
3 -
Database Connection
2,214 -
Datasets
5,211 -
Date Time
3,224 -
Demographic Analysis
185 -
Designer Cloud
735 -
Developer
4,352 -
Developer Tools
3,521 -
Documentation
525 -
Download
1,034 -
Dynamic Processing
2,928 -
Email
925 -
Engine
145 -
Enterprise (Edition)
1 -
Error Message
2,250 -
Events
195 -
Expression
1,867 -
Financial Services
1 -
Full Creator
2 -
Fun
2 -
Fuzzy Match
710 -
Gallery
666 -
GenAI Tools
2 -
General
2 -
Google Analytics
155 -
Help
4,698 -
In Database
964 -
Input
4,287 -
Installation
358 -
Interface Tools
1,895 -
Iterative Macro
1,090 -
Join
1,952 -
Licensing
249 -
Location Optimizer
60 -
Machine Learning
259 -
Macros
2,852 -
Marketo
12 -
Marketplace
23 -
MongoDB
82 -
Off-Topic
5 -
Optimization
749 -
Output
5,236 -
Parse
2,322 -
Power BI
227 -
Predictive Analysis
936 -
Preparation
5,156 -
Prescriptive Analytics
205 -
Professional (Edition)
4 -
Publish
257 -
Python
850 -
Qlik
39 -
Question
1 -
Questions
2 -
R Tool
476 -
Regex
2,338 -
Reporting
2,428 -
Resource
1 -
Run Command
572 -
Salesforce
276 -
Scheduler
410 -
Search Feedback
3 -
Server
626 -
Settings
931 -
Setup & Configuration
3 -
Sharepoint
624 -
Spatial Analysis
597 -
Starter (Edition)
1 -
Tableau
511 -
Tax & Audit
1 -
Text Mining
468 -
Thursday Thought
4 -
Time Series
430 -
Tips and Tricks
4,176 -
Topic of Interest
1,123 -
Transformation
3,714 -
Twitter
23 -
Udacity
84 -
Updates
1 -
Viewer
3 -
Workflow
9,947
- « Previous
- Next »