Alteryx Designer Desktop Discussions
Find answers, ask questions, and share expertise about Alteryx Designer Desktop and Intelligence Suite.- Community
- :
- Community
- :
- Participate
- :
- Discussions
- :
- Designer Desktop
- :
- How to add new rows to a data set
How to add new rows to a data set
- Subscribe to RSS Feed
- Mark Topic as New
- Mark Topic as Read
- Float this Topic for Current User
- Bookmark
- Subscribe
- Mute
- Printer Friendly Page
- Mark as New
- Bookmark
- Subscribe
- Mute
- Subscribe to RSS Feed
- Permalink
- Notify Moderator
Team,
I have a dataset where I have sales people name in rows and sales target achieved for different periods in columns.
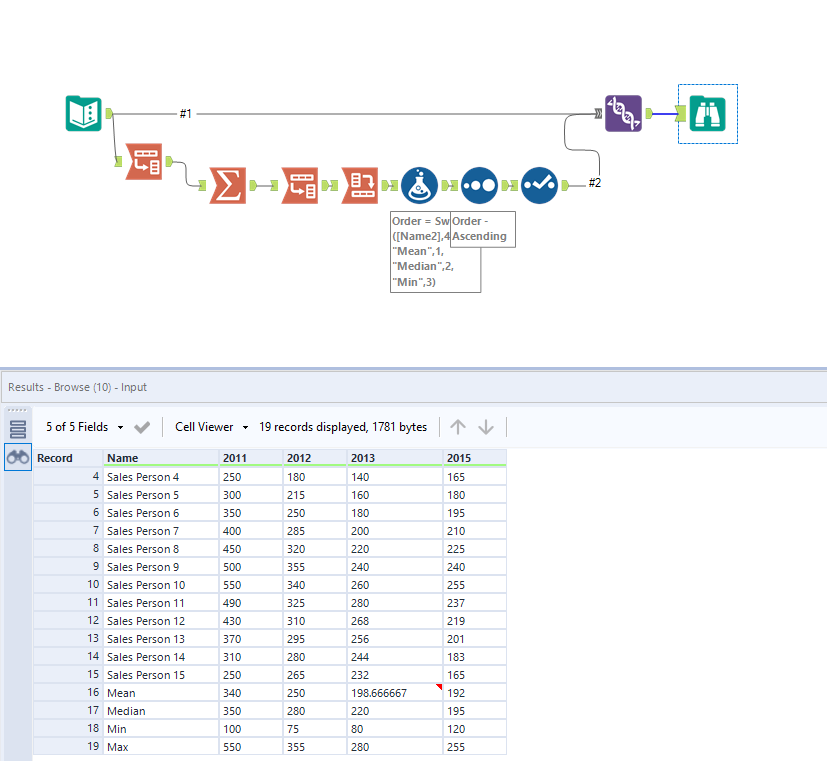
I just want to add Mean, Median, Max and Min below the data for different time periods (All the things I need to add are in yellow in the attached excel.)
Kindly let me know how to do it.
Regards,
P
Solved! Go to Solution.
- Labels:
-
Reporting
- Mark as New
- Bookmark
- Subscribe
- Mute
- Subscribe to RSS Feed
- Permalink
- Notify Moderator
- Mark as New
- Bookmark
- Subscribe
- Mute
- Subscribe to RSS Feed
- Permalink
- Notify Moderator
- Mark as New
- Bookmark
- Subscribe
- Mute
- Subscribe to RSS Feed
- Permalink
- Notify Moderator
I agree, @saveeshkumar method is much eaiser and has less steps for this usecase 🙂
- Mark as New
- Bookmark
- Subscribe
- Mute
- Subscribe to RSS Feed
- Permalink
- Notify Moderator
Thanks a lot, very helpful:)
- Mark as New
- Bookmark
- Subscribe
- Mute
- Subscribe to RSS Feed
- Permalink
- Notify Moderator
Thanks Saveesh, very helpful.
Quick follow-up. What if we had 2 more columns say Salesperon region and designation (these 2 new columns to the right of salesperson name and left of sales achieved). So, basically the new columns will not have any mean/median /max etc. Will the below flow still work or will I have to tweak it a bit?
Regards,
PS
- Mark as New
- Bookmark
- Subscribe
- Mute
- Subscribe to RSS Feed
- Permalink
- Notify Moderator
-
Academy
6 -
ADAPT
2 -
Adobe
204 -
Advent of Code
3 -
Alias Manager
78 -
Alteryx Copilot
25 -
Alteryx Designer
7 -
Alteryx Editions
95 -
Alteryx Practice
20 -
Amazon S3
149 -
AMP Engine
252 -
Announcement
1 -
API
1,208 -
App Builder
116 -
Apps
1,360 -
Assets | Wealth Management
1 -
Basic Creator
15 -
Batch Macro
1,559 -
Behavior Analysis
246 -
Best Practices
2,695 -
Bug
719 -
Bugs & Issues
1 -
Calgary
67 -
CASS
53 -
Chained App
268 -
Common Use Cases
3,825 -
Community
26 -
Computer Vision
86 -
Connectors
1,426 -
Conversation Starter
3 -
COVID-19
1 -
Custom Formula Function
1 -
Custom Tools
1,938 -
Data
1 -
Data Challenge
10 -
Data Investigation
3,487 -
Data Science
3 -
Database Connection
2,220 -
Datasets
5,222 -
Date Time
3,227 -
Demographic Analysis
186 -
Designer Cloud
741 -
Developer
4,372 -
Developer Tools
3,530 -
Documentation
527 -
Download
1,037 -
Dynamic Processing
2,939 -
Email
928 -
Engine
145 -
Enterprise (Edition)
1 -
Error Message
2,258 -
Events
198 -
Expression
1,868 -
Financial Services
1 -
Full Creator
2 -
Fun
2 -
Fuzzy Match
712 -
Gallery
666 -
GenAI Tools
3 -
General
2 -
Google Analytics
155 -
Help
4,708 -
In Database
966 -
Input
4,293 -
Installation
361 -
Interface Tools
1,901 -
Iterative Macro
1,094 -
Join
1,958 -
Licensing
252 -
Location Optimizer
60 -
Machine Learning
260 -
Macros
2,864 -
Marketo
12 -
Marketplace
23 -
MongoDB
82 -
Off-Topic
5 -
Optimization
751 -
Output
5,255 -
Parse
2,327 -
Power BI
228 -
Predictive Analysis
937 -
Preparation
5,169 -
Prescriptive Analytics
206 -
Professional (Edition)
4 -
Publish
257 -
Python
855 -
Qlik
39 -
Question
1 -
Questions
2 -
R Tool
476 -
Regex
2,339 -
Reporting
2,433 -
Resource
1 -
Run Command
575 -
Salesforce
277 -
Scheduler
411 -
Search Feedback
3 -
Server
630 -
Settings
935 -
Setup & Configuration
3 -
Sharepoint
627 -
Spatial Analysis
599 -
Starter (Edition)
1 -
Tableau
512 -
Tax & Audit
1 -
Text Mining
468 -
Thursday Thought
4 -
Time Series
431 -
Tips and Tricks
4,187 -
Topic of Interest
1,126 -
Transformation
3,730 -
Twitter
23 -
Udacity
84 -
Updates
1 -
Viewer
3 -
Workflow
9,980
- « Previous
- Next »


