Alteryx Designer Desktop Discussions
Find answers, ask questions, and share expertise about Alteryx Designer Desktop and Intelligence Suite.- Community
- :
- Community
- :
- Participate
- :
- Discussions
- :
- Designer Desktop
- :
- Re: Create pie chart in R the Tool
Create pie chart in R the Tool
- Subscribe to RSS Feed
- Mark Topic as New
- Mark Topic as Read
- Float this Topic for Current User
- Bookmark
- Subscribe
- Mute
- Printer Friendly Page
- Mark as New
- Bookmark
- Subscribe
- Mute
- Subscribe to RSS Feed
- Permalink
- Notify Moderator
I need assistance in creating a simple pie chart in the R tool in Alteryx.
My end goal is to create a Harvey ball where the 2 colors used are red and green. Red = loss and Green = Win. (example below)

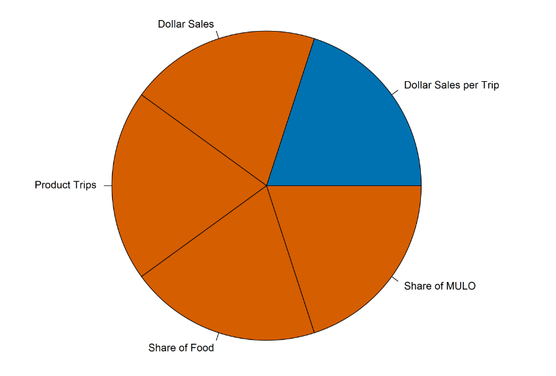
The issue I am facing is that the R Tool is not recognizing my input for the Red and Green. It outputs the colors Orange and Blue instead. (Example below).

Here is my R Code:
df <- read.Alteryx("#1", mode="data.frame")
AlteryxGraph(2, width=2400, height=3000, res=300)
pie(df$Value, df$Name, main = "Banner1", col = df$Color)
invisible(dev.off())
Solved! Go to Solution.
- Mark as New
- Bookmark
- Subscribe
- Mute
- Subscribe to RSS Feed
- Permalink
- Notify Moderator
Hi @agcruz
Are your color names in lower case as in this example from http://www.r-tutor.com/elementary-statistics/qualitative-data/pie-chart
> colors = c("red", "yellow", "green", "violet",
+   "orange", "blue", "pink", "cyan")
> pie(school.freq,             # apply the pie function
+   col=colors)                # set the color palette
Dan
- Mark as New
- Bookmark
- Subscribe
- Mute
- Subscribe to RSS Feed
- Permalink
- Notify Moderator
I have used the lowercase text for the colors but still get the same error.
- Mark as New
- Bookmark
- Subscribe
- Mute
- Subscribe to RSS Feed
- Permalink
- Notify Moderator
I got my code to work.
I figured out that I should an extra line in R to create a field with the color selection in stead of creating the field before the R tool. The code is below.
df <- read.Alteryx("#1", mode="data.frame")
AlteryxGraph(1, width=2400, height=3000, res=300)
df$color <- ifelse(df$ColorNumber == 1,"green3","red2")
pie(df$Value, df$Name, main = df$ChartTitle, col = df$color)
invisible(dev.off())
Thanks!
-
Academy
6 -
ADAPT
2 -
Adobe
204 -
Advent of Code
3 -
Alias Manager
78 -
Alteryx Copilot
27 -
Alteryx Designer
7 -
Alteryx Editions
96 -
Alteryx Practice
20 -
Amazon S3
149 -
AMP Engine
252 -
Announcement
1 -
API
1,210 -
App Builder
116 -
Apps
1,360 -
Assets | Wealth Management
1 -
Basic Creator
15 -
Batch Macro
1,559 -
Behavior Analysis
246 -
Best Practices
2,696 -
Bug
720 -
Bugs & Issues
1 -
Calgary
67 -
CASS
53 -
Chained App
268 -
Common Use Cases
3,825 -
Community
26 -
Computer Vision
86 -
Connectors
1,426 -
Conversation Starter
3 -
COVID-19
1 -
Custom Formula Function
1 -
Custom Tools
1,939 -
Data
1 -
Data Challenge
10 -
Data Investigation
3,489 -
Data Science
3 -
Database Connection
2,221 -
Datasets
5,223 -
Date Time
3,229 -
Demographic Analysis
186 -
Designer Cloud
743 -
Developer
4,376 -
Developer Tools
3,534 -
Documentation
528 -
Download
1,038 -
Dynamic Processing
2,941 -
Email
929 -
Engine
145 -
Enterprise (Edition)
1 -
Error Message
2,262 -
Events
198 -
Expression
1,868 -
Financial Services
1 -
Full Creator
2 -
Fun
2 -
Fuzzy Match
714 -
Gallery
666 -
GenAI Tools
3 -
General
2 -
Google Analytics
155 -
Help
4,711 -
In Database
966 -
Input
4,296 -
Installation
361 -
Interface Tools
1,902 -
Iterative Macro
1,095 -
Join
1,960 -
Licensing
252 -
Location Optimizer
60 -
Machine Learning
260 -
Macros
2,866 -
Marketo
12 -
Marketplace
23 -
MongoDB
82 -
Off-Topic
5 -
Optimization
751 -
Output
5,259 -
Parse
2,328 -
Power BI
228 -
Predictive Analysis
937 -
Preparation
5,171 -
Prescriptive Analytics
206 -
Professional (Edition)
4 -
Publish
257 -
Python
855 -
Qlik
39 -
Question
1 -
Questions
2 -
R Tool
476 -
Regex
2,339 -
Reporting
2,434 -
Resource
1 -
Run Command
576 -
Salesforce
277 -
Scheduler
411 -
Search Feedback
3 -
Server
631 -
Settings
936 -
Setup & Configuration
3 -
Sharepoint
628 -
Spatial Analysis
599 -
Starter (Edition)
1 -
Tableau
512 -
Tax & Audit
1 -
Text Mining
468 -
Thursday Thought
4 -
Time Series
432 -
Tips and Tricks
4,187 -
Topic of Interest
1,126 -
Transformation
3,732 -
Twitter
23 -
Udacity
84 -
Updates
1 -
Viewer
3 -
Workflow
9,983
- « Previous
- Next »
