I am inquiring about the feasibility of generating two distinct 3D graphs within the Alteryx platform, without necessitating any form of integration. If such an approach is viable, I kindly request guidance on the procedural steps involved in achieving this objective. Your expertise in elucidating this matter would be greatly appreciated.
I don’t think I have seen 3D graphs in Alteryx before with the Interactive Chart tool - make sure to search around the Community, otherwise I’m not sure if it’s possible without R / Python
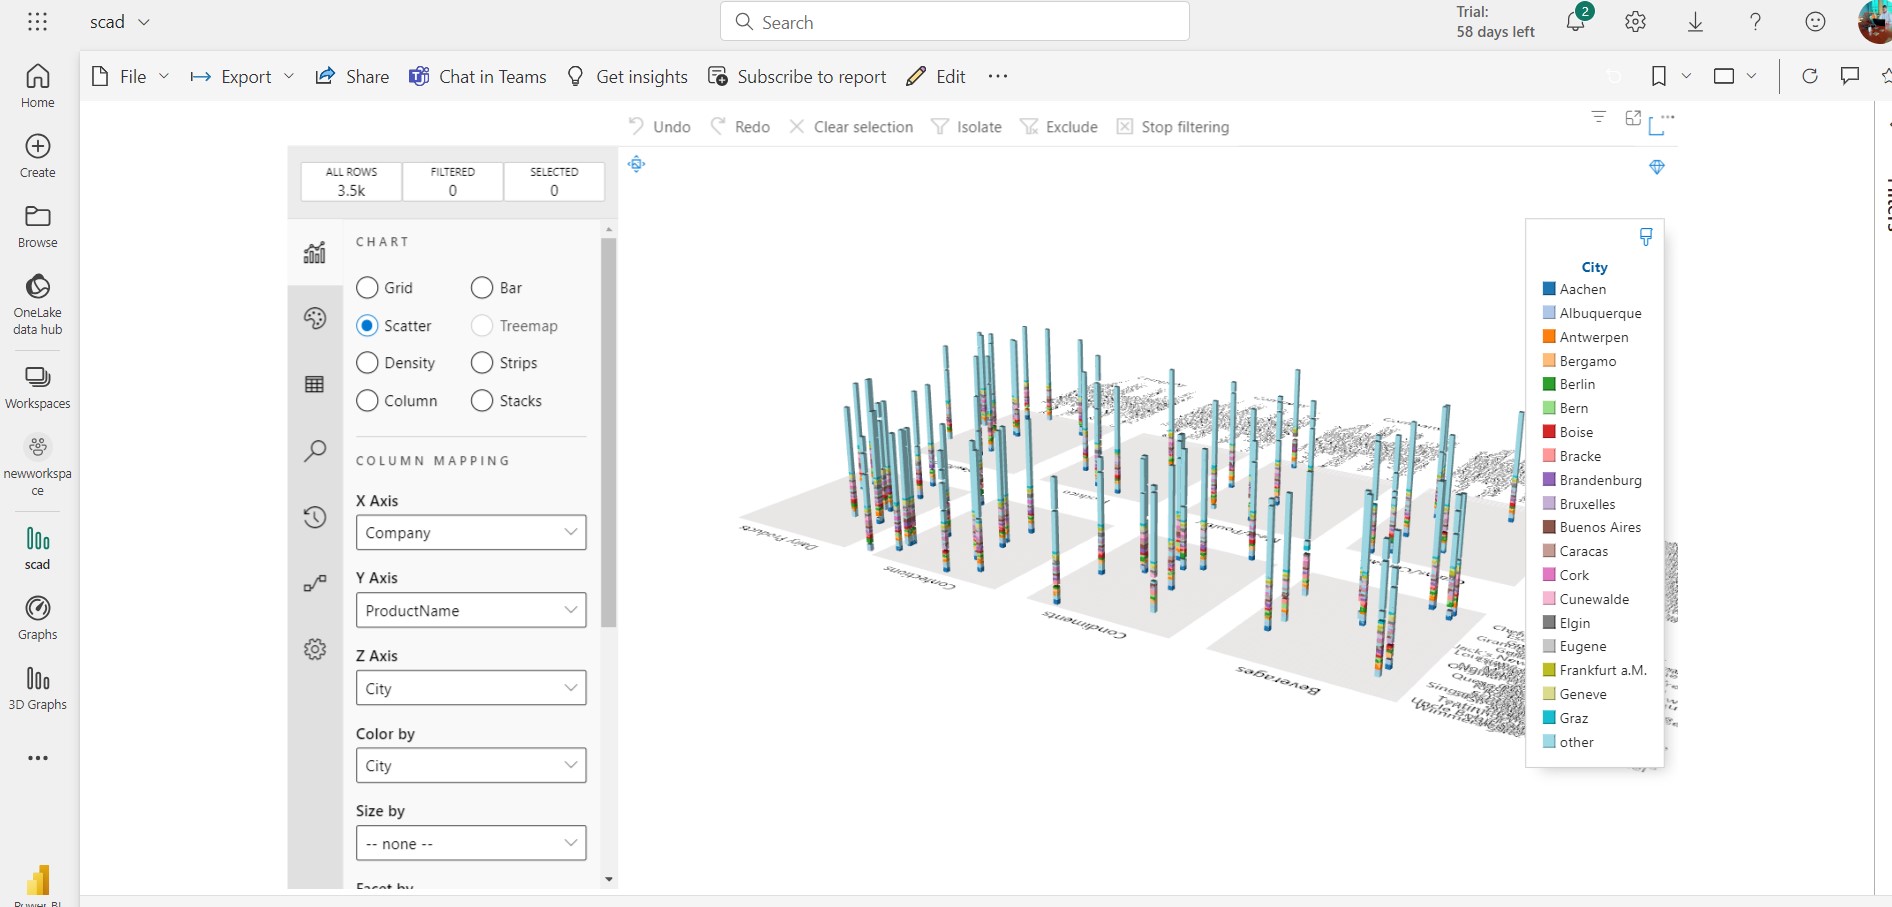
This is how it is: In Alteryx, you cannot create 3D graphs directly. However, in Power BI, you can create 3D graphs using a tool called SandDance. After creating these graphs in Power BI, you can later integrate them with Alteryx.