Dive deeper into solving problems with Alteryx, explore new frontiers in your analytics journey, and push yourself to prove and improve your skills with...
The Alteryx education program providing software licenses, teaching tools, and learning pathways to empower learners to question, understand and solve...
Need to level-up your knowledge but don’t have time for a long read? Tune in to our podcasts to cover analytics culture, data science, and everything in...
Hi Maveryx,
A solution to last week’s challenge can be found here.
This challenge was submitted by our ACE and an active member in the Alteryx Community, Ippei Nakagawa (@gawa) . Thank you Gawa for your contribution and we look forward to the next ones that you may bring to the table!
Across the United States, an annular solar eclipse was observed on October 14, 2023, and a total solar eclipse will be observed on April 8, 2024. In this challenge, you will determine which lucky cities in the USA observed an annular solar eclipse in 2023 and which ones will observe the total solar eclipse in 2024, as well as one lucky city that will observe both! The provided datasets include solar eclipse information from 2023 and 2024 including the name of the city; latitude and longitude of the city; how long the eclipse will last; and the eclipse’s category (P: partial, T: total, A: annual).
Your tasks:
Create a combined list of the cities that observed the annular eclipse in 2023 and which cities will observe the total eclipse in 2024.
Create a map to visualize each eclipse’s path throughout the year for 2023 and 2024.
Determine the lucky city that will get to see both eclipses!
Hint: The provided datasets are JSON files. To facilitate the data extraction, use the Parse JSON tool in the Developer tab of Designer.
Need a refresher? Review these lessons in Academy to gear up:
Changing Data Layouts
Parsing JSON
Creating Spatial Objects
Sources: https://svs.gsfc.nasa.gov/ https://svs.gsfc.nasa.gov/vis/a000000/a005000/a005073/2023_city_times.json
https://svs.gsfc.nasa.gov/vis/a000000/a005000/a005073/2024_city_times.json
Good luck!
... View more
Hi Maveryx,
A solution to last week’s challenge can be found here.
This challenge was submitted by @AkimasaKajitani . Thanks Aki for this great contribution!
You and your friends enjoy high-energy songs. Since your friends know you are skilled at using Alteryx, they have asked you to create a 60-minute playlist using the Optimization tool. This playlist should contain the most popular and energetic songs, each included only once.
Each record in the provided dataset contains the variable (song ID), song name, popularity, level of energy (ranging from 0 to 1, with 0 being less energetic and 1 being more energetic), and song duration. Additionally, you are given the formatted for the B anchor of the Optimization tool. This represents the maximum duration of 3600 seconds, or 60 minutes (rhs).
Your task is to create a maximum 60-minute playlist that maximizes song popularity from the top 100 high-energy songs. Each song should only be included once. Additionally, output the total popularity value of (Objective ).
Summary of Data:
You are provided with a file containing a song popularity dataset with energy values for each song and its duration. Additionally, you are given the formatted input for the B anchor or the Optimization tool.
Hints:
Ensure you select Maximize Objective in the Optimization tool settings and spend most of your time structuring the data for the Specify the Model as Matrices option. You will not need to change any other settings in the tool (other than Maximize Objective).
Field names matter! Check out this article, which features data format.
song_popularity = coefficient
lb and ub values are a binary datatype of 0,1
Need a refresher? Review these resources to gear up:
Tool Mastery | Optimization
Article: Beginners Guide To Alteryx Optimization
Help Documentation: Optimization Tool
Source: The dataset was modified to align with the learning objectives of the challenge. https://www.kaggle.com/datasets/maharshipandya/-spotify-tracks-dataset
Good luck!
... View more
A solution to last week’s challenge can be found here.
When working with a traditional spreadsheet, it's relatively straightforward to summarize over rows and columns. But we often would like to do something similar in Designer! We also have the added feature to be able to create reports in a variety of formats.
For this challenge, find the total cost for all food items for each country as well as the total cost for each food item. Then create a report of your choice to show your findings.
Hint: How to Generate and Format Totals and Subtotals
https://community.alteryx.com/t5/Engine-Works/How-to-Generate-and-Format-Totals-and-Subtotals/ba-p/916853
... View more
A solution to last week's challenge can be found here!
We are thrilled to present another Challenge from our “Think like a CSE” series, brought to you by our fearless team of Customer Support Engineers. Each month, the Customer Support team will ask Community members to “think like a CSE” to try to resolve a case that was inspired by real-life issues encountered by Alteryx users like you!
This month we present the case of ranking ratings in descending order. Below, we’ve provided the information that was initially available to the Customer Support Engineer who resolved the case. It’s up to you to use this information to put a solution together for yourself.
The Case: A User is trying to create a column of rank for an input dataset. Like the Rank function in SQL, we want to return the rank of each row within the partition of a result set. The rank of a row is one plus the number of ranks that come before the row in question. Please see the images below for an example.
Ranking data
Your Goal: Create a Rank column like the Rank function in SQL.
... View more
Last week's solution is now up - find it here!
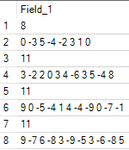
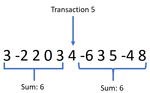
This week, we are looking at a few accounts. In this set of data, there are 4 accounts. The first row of every account represents the number of credits/debits against the account, and the second row represents the actual credits and debits paid against the account in the order they were paid. Your task is to find the credits and debits where the sum of debits and credits BEFORE any transaction is equal to the sum of debits and credits AFTER it. Please count the transactions from 0 to match the answer. Below is a picture that illustrates the logic of which transactions should be captured. The picture represents the second account.
Sample logic:
... View more