Data Science
Machine learning & data science for beginners and experts alike.- Community
- :
- Community
- :
- Learn
- :
- Blogs
- :
- Data Science
- :
- Expand Your Predictive Palette II: Beyond K-Means
- Subscribe to RSS Feed
- Mark as New
- Mark as Read
- Bookmark
- Subscribe
- Printer Friendly Page
- Notify Moderator
After enriching our supervised learning palette, folks asked: How about an unsupervised technique like clustering or dimension reduction?
Indeed, a common data science statistic is that 80% of our work is data preparation; one of our common tasks is to group the data points into various clusters with similar properties and characteristics. These segments help us to generate useful features for model training, draw inferences from unlabeled data and detect outliers!

In Alteryx, we provided one of the most common clustering methods: K-Centroids (both k-means & k-medians). This type of partition-based algorithm is very good at large scale implementation. Inspired by @DrDan, I'll describe two other methods we can leverage with R and Python:
- DBSCAN: Density-based; Faster; Good at finding a hidden pattern. An alternative for large dataset deployment
- Hierarchical Clustering: Tree-based. Intuitive. Good at visualizing the cluster relationship. Exploration-oriented.
Let’s Start
We are going to explore the Melbourne housing market. Download the workflows & macros here from the Alteryx Gallery. (Note: you will need to install two additional R packages (factoextra and dbscan) before running this workflow.)
Our objective is to improve the house price prediction by adding the clusters as a new feature. The workflow mainly divides into three parts:
- Left: Data cleansing and normalizing the unit of calculation. There are many scalers in the market; here is MinMaxScaler tool in Python
- Middle: Clustering modeling. Contains three tools: DBSCAN, Hierarchical Cluster, & Cluster Evaluator
- Right: Cluster correlation and evaluation via Linear Regression. Together with two images for chart interpretation
Run the workflow and check out the linear regression model interactive (I) output; you will find that the model with the cluster features has a higher R-square from 0.267 to 0.269. MISSION COMPLETE! Easy?
Let’s dive into the model configuration and tune it to increase the R-square further:
1/3: DBSCAN

The theory of DBSCAN (density-based spatial clustering of applications with noise) is to group together points that are close to each other based on EPS rate (defined below) and a minimum number of points. The tool has one input anchor for data, and two output anchors: O for the output data, and R for the report for evaluation charts, which contains our KNN Distance Chart & Cluster Chart. Let’s look at the parameters:
Parameter Input
- EPS (Epsilon):
- Specifies how close points should be to each other to be considered a part of a cluster.
- Start at 0.1. Tuning based on the KNN distance chart. Open the DBSCAN R output after running
- Below are two examples, the key is to look for the turning point.
- Minimum Points:
- Specifies how many neighbors a point should have in a cluster.
- Start at 3. Tuning based on the number of dimensions/variables/columns
- As a general rule, derive minPoints ≥ D + 1. In this example, the dataset has 7 variables, so 8 is a good start.
Parameter Evaluation with Cluster Chart
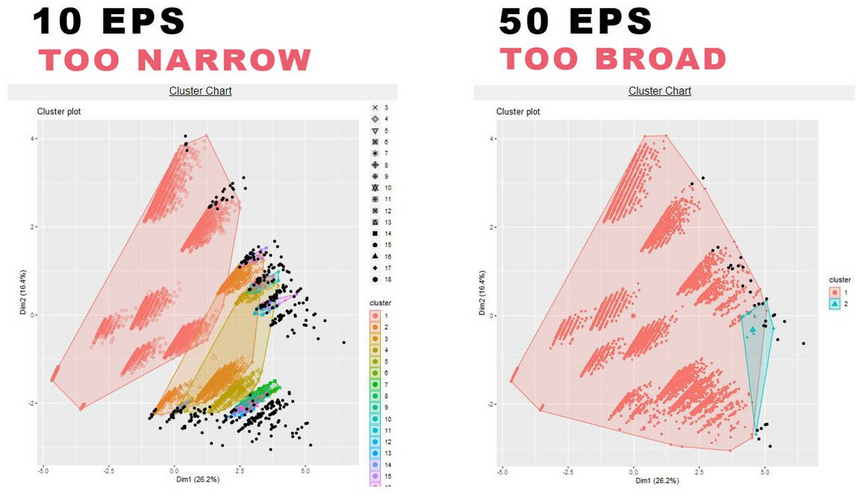
In the same R output, the cluster chart shows how the models perform:
If the majority of data is black, which is not captured, the EPS rate is too low or minPt is too high.
If most data is captured within one single cluster, the EPS is too high or minPts is too low.
Parameter Evaluation with Correlation Matrix
Another way to examine the cluster model is to use the Correlation Matrix under the Association Analysis tool. The more highly correlated the variables are to the cluster, the better your selected parameter values are for your data.
Now, try out the example before moving on. The previous record is 0.271, with EPS 20 and Minimum Point 30.
Wait, how about Python?
Inside the workflow, there is a Python tool contains DBSCAN script.
Wait, more examples?
We got you covered! Credited to @M_E EL JAAFARI, here is another DBSCAN python application:
Partitioning Spatial Data with DBSCAN
2/3: Hierarchical Clustering
Hierarchical clustering mainly divides into two types: agglomerative (bottom-up approach) and divisive (top-down approach). Generally, we refer to the agglomerative approach.
In agglomerative clustering, each data point begins as a singleton cluster. Every iteration, the similar points combine into clusters until the final “top” cluster forms. Comparatively, in divisive clustering, all points start as a single cluster, which is then split recursively. The difference between the two approaches is here.
Now, let’s disable the DBSCAN container and open the Hierarchical Cluster container. Replace the original connection to Join Tool Left Input anchor with the Hierarchical Cluster Tool O output anchor, then run again.
The R-squared score increased to 0.295!
Same as DBSCAN, the tool outputs a report for evaluation, which is the essence of the model: the dendrogram. This tree-like diagram will help us to find the number of clusters and visualize the relationship between the variables. First of all, let’s understand the two key parameters.
Parameter Input
- Distance Method:
- The metric that defines the distance matrix (or the way you describe the distance between sets of points)
- The most commonly used are Euclidean and Manhattan distances
- Hierarchical Algorithms:
- Calculating the similarity between clusters
- The most commonly used are single linkage, complete linkage and average linkage
Clearly, there are too many different combinations of these two parameters to try each by hand. I would suggest users start with Euclidean distance, used with one of these hierarchical clustering algorithm options: single linkage, complete linkage and average linkage, then tune it further. Here is a good reference.
Parameter Evaluation with a Dendrogram
By default, users don’t need to specify the number of clusters. Select the distance and algorithm first, and a dendrogram (tree diagram) will be generated.
Looking at the y-axis = distance value, you could eyeball the number of clusters. The rule of thumb is betweeness - not too distributed, nor too dense. In this case, five clusters generate the best results.
Hold on, does this mean we have to try it one by one?
Not at all!
3/3: Automatic Cluster Evaluators
There are several algorithms to calculate the optimal number of clusters, including the Elbow rule, the Silhouette rule, and the Gap Statistic.

There is one more package that has becomes popular, called NbClust which computes 30 indices, then picks up the best using the “majority rule.”
Here is the final and very powerful tool: the Cluster Evaluator. It allows you to run all four analyses at once!
Select the cluster algorithm you are testing, then select the methods. Depending on your machine specs, you can start with Elbow, which takes the least amount of time to run; the last option, NbCluster, takes longer.
After running, you will have three reports in a single output, which gives you an idea that 4 to 6 clusters is a good parameter based on three methods. And it applies to k-means, as well!
End. And?
That's all for now. To summarize, we learned two more new clustering techniques: DBSCAN and Hierarchical Clustering, and how to tune them for the new data. Moreover, we have a new tool to help us auto-search the optimal number of clusters for k-means and hierarchical clustering! Feel free to open the macro, modify the script and enrich the tool as your specialized clustering algorithm! Enjoy.
Additional resources:
You must be a registered user to add a comment. If you've already registered, sign in. Otherwise, register and sign in.


![giphy[1].gif giphy[1].gif](https://community.alteryx.com/t5/image/serverpage/image-id/78439iEC35395DC75125B2/image-size/large?v=v2&px=999)