Alteryx Server Discussions
Find answers, ask questions, and share expertise about Alteryx Server.- Community
- :
- Community
- :
- Participate
- :
- Discussions
- :
- Server
- :
- Alteryx — Design for Enterprise level Logging and ...
Alteryx — Design for Enterprise level Logging and Altering
- Subscribe to RSS Feed
- Mark Topic as New
- Mark Topic as Read
- Float this Topic for Current User
- Bookmark
- Subscribe
- Mute
- Printer Friendly Page
- Mark as New
- Bookmark
- Subscribe
- Mute
- Subscribe to RSS Feed
- Permalink
- Notify Moderator
Like with any system the essence of debugging lies in how meaningful the logs are and Alteryx workflows are no exception. For enterprise systems using Alteryx three main aspects have to be paid attention to :
- What information to log and how
- How to access it
- Who should be alerted
What information to log and how
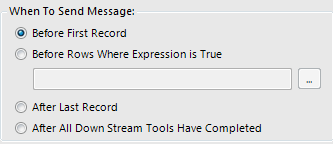
Answer to what is pretty straightforward, it should be what will help you identify the root cause. During the workflow execution, Alteryx will itself generate tool id, start-and-end message, and standard information generated by the tool like SQL executed by the Input tool, etc. Besides this, you can utilize the Message tool to create custom messages that will become part of the log. The Message Tool can be set up to pick up records before, during, and after the records have passed through the tool itself. This makes it useful for evaluating your dataset at different parts of your workflow.


How to access it
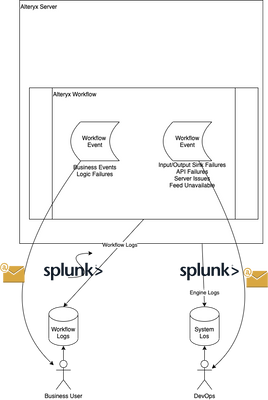
On the Alteryx server, there are two types of logs generated :
- Server (Engine) logs
- Workflow execution logs
Server logs contain information about the Alteryx runtime environment and are meaningful to the people supporting the Alteryx service (DevOps).
Workflow execution contains information on the processing of the business logic, data transformation, and interaction with input/output data sources. This is meaningful to the Business users and DevOps team.
As the two data sets cater to a different user base they should be persisted separately. The most common tool available in the market is Splunk, which can house this data set in two different indices with specific permissions.


Who should be Alerted
Apart from making the information available in Splunk, there is a need to alert Business users and/or DevOps team in case of specific events. These events could be categorized into two broad categories
- Business events — these include failures due to incorrect data type, business calculation, etc. which Business users should know so that they know the cause of failure and can take corrective action.
- Events related to interfacing systems — these cover unavailability of feeds, databases, API services, etc. which DevOps team should be notified for followup
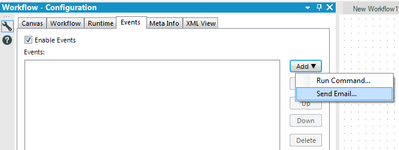
As both the events need immediate attention, they are best served by an email alert and can be set up using the Workflow “Events”. This is found under “Events” in the workflow configuration panel.


In this way, you achieve the following:
- Provide self-service log review capability to Business users
- Separate out service and workflow related information
- Create an immutable source of logs using Splunk for audit
- Generate alerts for Business and Service events
- Mark as New
- Bookmark
- Subscribe
- Mute
- Subscribe to RSS Feed
- Permalink
- Notify Moderator
There are actually more than just 2 😉 Gallery Logs. AAS Logs as well 😁
- Mark as New
- Bookmark
- Subscribe
- Mute
- Subscribe to RSS Feed
- Permalink
- Notify Moderator
you are correct, point i am elaborating is you can separate out the logs so that concerned parties get the information they need. If I am not mistaken aas logs get created only when you have SAML based authentication. If you have windows integrated solution then I have not seen them being generated
-
Administration
1 -
Alias Manager
28 -
Alteryx Designer
1 -
Alteryx Editions
3 -
AMP Engine
38 -
API
385 -
App Builder
18 -
Apps
298 -
Automating
1 -
Batch Macro
58 -
Best Practices
317 -
Bug
96 -
Chained App
96 -
Common Use Cases
131 -
Community
1 -
Connectors
157 -
Database Connection
336 -
Datasets
73 -
Developer
1 -
Developer Tools
133 -
Documentation
118 -
Download
96 -
Dynamic Processing
89 -
Email
81 -
Engine
42 -
Enterprise (Edition)
1 -
Error Message
415 -
Events
48 -
Gallery
1,419 -
In Database
73 -
Input
180 -
Installation
140 -
Interface Tools
180 -
Join
15 -
Licensing
71 -
Macros
149 -
Marketplace
4 -
MongoDB
262 -
Optimization
62 -
Output
273 -
Preparation
1 -
Publish
199 -
R Tool
20 -
Reporting
99 -
Resource
2 -
Run As
64 -
Run Command
102 -
Salesforce
35 -
Schedule
258 -
Scheduler
357 -
Search Feedback
1 -
Server
2,200 -
Settings
541 -
Setup & Configuration
1 -
Sharepoint
85 -
Spatial Analysis
14 -
Tableau
71 -
Tips and Tricks
232 -
Topic of Interest
49 -
Transformation
1 -
Updates
90 -
Upgrades
197 -
Workflow
600
- « Previous
- Next »