Alteryx Designer Desktop Discussions
Find answers, ask questions, and share expertise about Alteryx Designer Desktop and Intelligence Suite.- Community
- :
- Community
- :
- Participate
- :
- Discussions
- :
- Designer Desktop
- :
- Table Formatting (colouring and sorting)
Table Formatting (colouring and sorting)
- Subscribe to RSS Feed
- Mark Topic as New
- Mark Topic as Read
- Float this Topic for Current User
- Bookmark
- Subscribe
- Mute
- Printer Friendly Page
- Mark as New
- Bookmark
- Subscribe
- Mute
- Subscribe to RSS Feed
- Permalink
- Notify Moderator
Hi Community,
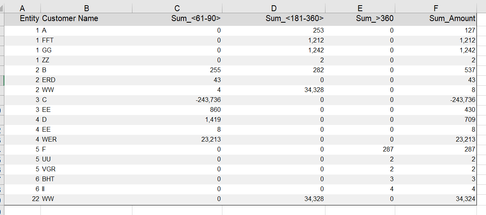
Currently i had built the workflow and the result as per screenshot below :
However, i would like to do some sorting on the figure for the column F with the criteria below:
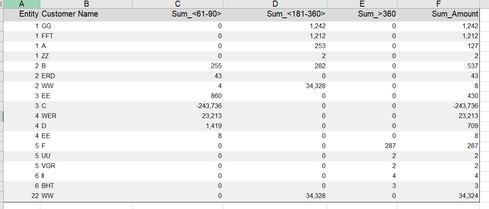
1. For each respective entity, i plan to do sort the value under the column F from the largest to the smallest accordingly for each entity. The desired result will be as follow :
After performing the sorting, i would like to ask Alteryx to do some colouring on the full row based on the criteria below:
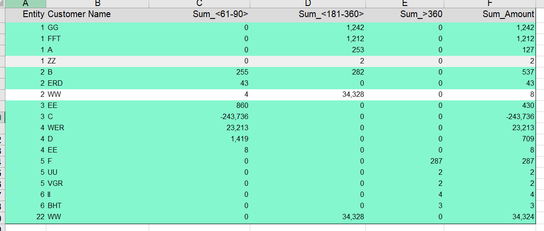
2. Based on the top three amount under column F for each entity, colour the respective row with green colour for each respective entity . If the entity only have one or two amount (less than three) under column F, just colour the relevant one or two row for each respective entity. The result will be as below:
May i know if anyone know how to do the sorting and colouring in this case? I had also attached the workflow for your reference.
Many thanks in advance
Solved! Go to Solution.
- Labels:
-
Common Use Cases
- Mark as New
- Bookmark
- Subscribe
- Mute
- Subscribe to RSS Feed
- Permalink
- Notify Moderator
Hi @SH_94 ,
Can you check that this output is the one you are after?
The part in the comment box is that I added
And in your table tool I have added a row rule
- Mark as New
- Bookmark
- Subscribe
- Mute
- Subscribe to RSS Feed
- Permalink
- Notify Moderator
Hi @AngelosPachis ,
Thank you for the prompt response.Yup.I looked through the workflow and this is the result that i looking for. However
I not sure how to amend the following tools as per screenshot below. May i know do i need to amend anything for the part that circled and labelled as 1?
Secondly, could you briefly explain on the concept or the formula used at the part circled and labelled as 2? As i plan to amend it to fit my data if necessary. What it means by [row -1 ]+1 in this case?
Thirdly, may i know if the highlight wording below in Alteryx stand for the formula or just text name in this case? May i know is it both the wording must be consistent for the screenshot below?
Thanks again for your help.
- Mark as New
- Bookmark
- Subscribe
- Mute
- Subscribe to RSS Feed
- Permalink
- Notify Moderator
Hi @SH_94
For Questions 1 and 2 I would suggest you have a look at the example workflows for the multi-row formula tool and the help pages to get examples of how this tool works.
The formula says that for each entity (that's why on the group be sections Entity field is checked) take the value from the previous row of that field and add 1. That will create you a record ID for each entity in your dataset.
Thirdly, this is just the name of that row rule, and you can go and change it if you want. It has nothing to do with the formula but it's a means for you to understand what this row rules is about.
Hope that helps,
Angelos
-
Academy
6 -
ADAPT
2 -
Adobe
204 -
Advent of Code
3 -
Alias Manager
78 -
Alteryx Copilot
26 -
Alteryx Designer
7 -
Alteryx Editions
95 -
Alteryx Practice
20 -
Amazon S3
149 -
AMP Engine
252 -
Announcement
1 -
API
1,208 -
App Builder
116 -
Apps
1,360 -
Assets | Wealth Management
1 -
Basic Creator
15 -
Batch Macro
1,559 -
Behavior Analysis
246 -
Best Practices
2,695 -
Bug
719 -
Bugs & Issues
1 -
Calgary
67 -
CASS
53 -
Chained App
268 -
Common Use Cases
3,825 -
Community
26 -
Computer Vision
86 -
Connectors
1,426 -
Conversation Starter
3 -
COVID-19
1 -
Custom Formula Function
1 -
Custom Tools
1,938 -
Data
1 -
Data Challenge
10 -
Data Investigation
3,487 -
Data Science
3 -
Database Connection
2,220 -
Datasets
5,222 -
Date Time
3,227 -
Demographic Analysis
186 -
Designer Cloud
742 -
Developer
4,372 -
Developer Tools
3,530 -
Documentation
527 -
Download
1,037 -
Dynamic Processing
2,939 -
Email
928 -
Engine
145 -
Enterprise (Edition)
1 -
Error Message
2,258 -
Events
198 -
Expression
1,868 -
Financial Services
1 -
Full Creator
2 -
Fun
2 -
Fuzzy Match
712 -
Gallery
666 -
GenAI Tools
3 -
General
2 -
Google Analytics
155 -
Help
4,708 -
In Database
966 -
Input
4,293 -
Installation
361 -
Interface Tools
1,901 -
Iterative Macro
1,094 -
Join
1,958 -
Licensing
252 -
Location Optimizer
60 -
Machine Learning
260 -
Macros
2,864 -
Marketo
12 -
Marketplace
23 -
MongoDB
82 -
Off-Topic
5 -
Optimization
751 -
Output
5,255 -
Parse
2,328 -
Power BI
228 -
Predictive Analysis
937 -
Preparation
5,169 -
Prescriptive Analytics
206 -
Professional (Edition)
4 -
Publish
257 -
Python
855 -
Qlik
39 -
Question
1 -
Questions
2 -
R Tool
476 -
Regex
2,339 -
Reporting
2,434 -
Resource
1 -
Run Command
575 -
Salesforce
277 -
Scheduler
411 -
Search Feedback
3 -
Server
630 -
Settings
935 -
Setup & Configuration
3 -
Sharepoint
627 -
Spatial Analysis
599 -
Starter (Edition)
1 -
Tableau
512 -
Tax & Audit
1 -
Text Mining
468 -
Thursday Thought
4 -
Time Series
431 -
Tips and Tricks
4,187 -
Topic of Interest
1,126 -
Transformation
3,730 -
Twitter
23 -
Udacity
84 -
Updates
1 -
Viewer
3 -
Workflow
9,980
- « Previous
- Next »


