Data Science
Machine learning & data science for beginners and experts alike.- Community
- :
- Community
- :
- Learn
- :
- Blogs
- :
- Data Science
- :
- When and Why You Would Use the Alteryx R-Based Pre...
- Subscribe to RSS Feed
- Mark as New
- Mark as Read
- Bookmark
- Subscribe
- Printer Friendly Page
- Notify Moderator
 Introduced in the 7.1 release of Alteryx were 17 macros that enable data artisans to easily undertake predictive analytics projects. The predictive tools can be placed into several different groups based on the business analytics functions they perform. The groups are predictive modeling, model assessment, grouping, data investigation, and data sampling for predictive analytics. This post is the third in a 5-part series will focus on the grouping macros.
Grouping
There are predictive analytics macros that assist a data artisan in grouping both "units" (customers, outlets, transactions, etc.) and fields. A data artisan might be interested in grouping customers together based on past buying behavior or measured interest in product benefits to form customer segments, grouping outlets together based on trade area characteristics in order to implement merchandising or pricing programs, or grouping transactions together to look for outliers that might signal fraudulent activity. The macros for assisting a data artisan in grouping "units" together are:
 Clustering - K-Centroids Analysis
 Clustering - K-Centroids Diagnostics
 Clustering - Append
 The K-Centroids Clustering macro places "units" into a user specified number of groups, using one of three clustering algorithms: K-Means, K-Medians, or Neural Gas Clustering. The methods differ in the criteria used to form clusters, and in many cases one algorithm develops clusters with more desirable characteristics from a business perspective than the others. The K-Centroids Diagnostics macro directly assists the data artisan in determining the appropriate number of clusters to group units into for a specific clustering algorithm, and indirectly helps a data artisan assess which clustering algorithm to use for the final solution. Once a data artisan has developed a cluster solution that places units into relevant groups from a business perspective, the Append Cluster macro can be used to append a cluster identifier to a data table for both records used in the cluster analysis and for appropriate records not used in the clustering.
Examples of the use of K-Centroids Clustering to help address business decision include:
- A financial services provider grouping customers based on their account balances across different products to develop customer segments that can be used to help develop and target new service offerings
- A retailer grouping stores into “tiers” based on trade area population characteristics in order to develop and implement merchandising and pricing programs
- A network service provider that clusters historic network traffic activity into groups of “normal” and “anomalous” traffic levels in order to rapidly detect potential problems by identifying anomalies in network traffic in real time
The macro provided for grouping fields is:
 Principal Components
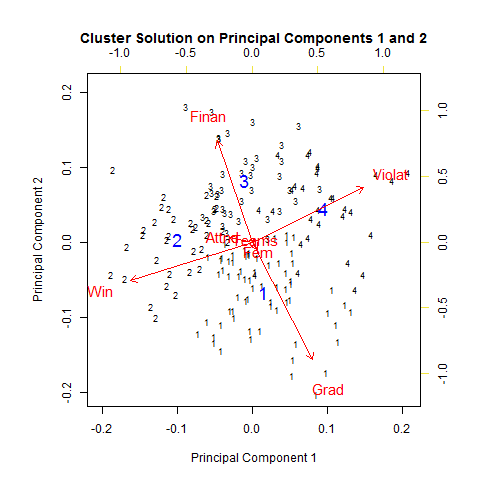 This macro will typically be used for one of two different purposes. First, much of the data used in business has multiple dimensions. However, we are only able to visualize relationships in two or three dimensions. Principal components analysis allows the data artisan to "compress" the number of dimensions (fields) in the data to a smaller number, allowing for the visualization of multiple relationships at the same time. The second use is in the development of predictive models. In many instances, the predictor fields available to a data artisan to develop a model are highly correlated with one another, which can lead to interpretation and other modeling problems. As a result, in some cases a data artisan may choose to develop models using the principal components of the data rather than the original fields.
In my next post, I will focus on the data investigation macros which allow a data artisan to both quickly understand the data they are working with and find important relationships in the data, both of which will provide valuable assistance in quickly developing effective predictive models and undertaking other forms of predictive analytics analysis.

Chief Scientist
Dr. Dan Putler is the Chief Scientist at Alteryx, where he is responsible for developing and implementing the product road map for predictive analytics. He has over 30 years of experience in developing predictive analytics models for companies and organizations that cover a large number of industry verticals, ranging from the performing arts to B2B financial services. He is co-author of the book, “Customer and Business Analytics: Applied Data Mining for Business Decision Making Using R”, which is published by Chapman and Hall/CRC Press. Prior to joining Alteryx, Dan was a professor of marketing and marketing research at the University of British Columbia's Sauder School of Business and Purdue University’s Krannert School of Management.
Dr. Dan Putler is the Chief Scientist at Alteryx, where he is responsible for developing and implementing the product road map for predictive analytics. He has over 30 years of experience in developing predictive analytics models for companies and organizations that cover a large number of industry verticals, ranging from the performing arts to B2B financial services. He is co-author of the book, “Customer and Business Analytics: Applied Data Mining for Business Decision Making Using R”, which is published by Chapman and Hall/CRC Press. Prior to joining Alteryx, Dan was a professor of marketing and marketing research at the University of British Columbia's Sauder School of Business and Purdue University’s Krannert School of Management.
You must be a registered user to add a comment. If you've already registered, sign in. Otherwise, register and sign in.