Dive deeper into solving problems with Alteryx, explore new frontiers in your analytics journey, and push yourself to prove and improve your skills with...
The Alteryx education program providing software licenses, teaching tools, and learning pathways to empower learners to question, understand and solve...
Need to level-up your knowledge but don’t have time for a long read? Tune in to our podcasts to cover analytics culture, data science, and everything in...
A solution to last week’s challenge can be found here.
This challenge was submitted by Jifeng Qiu (@Qiu) , a dedicated member of our Community. Qiu is the first person to earn our new Weekly Challenge Contributor Badge and will also receive special swag from Academy soon. Congratulations, Qiu, and we eagerly await more challenges!
The Academy Awards, officially known as the Oscars, honor artistic and technical merit in the film industry. The 96th Academy Awards 2024 is scheduled for Sunday, March 10, 2024, and will recognize movies released in 2023.
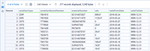
The first dataset contains information about movies nominated for the award from 1928 to 2023. The second dataset contains information on actors and actresses who were nominated for the 2024 Oscars and their respective movies.
For this challenge, only focus on the winner of the actor, actress, supporting actor, or supporting actress categories.
Your task this week is to find:
Actors/Actresses with eight or more nominations.
Actors/Actresses who have eight more nominations than they have total awards (do not consider nominees with zero awards).
Actors/Actresses who won every time they were nominated.
Actors/Actresses with five or more nominations who have never won.
2024 nominees who have won before.
Need a refresher? Review these lessons in Academy to gear up:
Joining Data
Filtering Data
Summarizing Data
Sources:
https://www.kaggle.com/datasets/unanimad/the-oscar-award
https://www.oscars.org/oscars/ceremonies/2024
Lights, Camera, Action!
... View more
A solution to last week’s challenge can be found here.
This week's challenge is relatively straightforward, but sometimes data needs trimming.
The following dataset includes a list of city, country, year, continent, and season (winter or summer)
for each Olympic Games except those canceled.
Your challenge is to find: - How many times has each continent hosted the Summer Olympics? - How many times has each continent hosted the Olympic Winter Games? - What is the total of the Olympic Games hosted for each continent, summer and winter combined?
Oh, easy, you may think. For this Challenge, you will have to propose 2 solutions and one that does not use the trim functions.
... View more
A solution to last week's challenge can be found here.
This dataset contains a list of holiday dates that are observed by each country from Feb. to Dec. 2020.
Your Challenge is to figure out for that period: - Which country has the most holidays and how many? - Some holidays are only observed by one country. Which country has the most unique days off and how many? - Which day is the most shared in the world as a holiday and which countries are sharing this holiday?
... View more
Hi Maveryx,
A solution to last week’s challenge can be found here.
This challenge was submitted by @AkimasaKajitani . Thanks Aki for this great contribution!
You and your friends enjoy high-energy songs. Since your friends know you are skilled at using Alteryx, they have asked you to create a 60-minute playlist using the Optimization tool. This playlist should contain the most popular and energetic songs, each included only once.
Each record in the provided dataset contains the variable (song ID), song name, popularity, level of energy (ranging from 0 to 1, with 0 being less energetic and 1 being more energetic), and song duration. Additionally, you are given the formatted for the B anchor of the Optimization tool. This represents the maximum duration of 3600 seconds, or 60 minutes (rhs).
Your task is to create a maximum 60-minute playlist that maximizes song popularity from the top 100 high-energy songs. Each song should only be included once. Additionally, output the total popularity value of (Objective ).
Summary of Data:
You are provided with a file containing a song popularity dataset with energy values for each song and its duration. Additionally, you are given the formatted input for the B anchor or the Optimization tool.
Hints:
Ensure you select Maximize Objective in the Optimization tool settings and spend most of your time structuring the data for the Specify the Model as Matrices option. You will not need to change any other settings in the tool (other than Maximize Objective).
Field names matter! Check out this article, which features data format.
song_popularity = coefficient
lb and ub values are a binary datatype of 0,1
Need a refresher? Review these resources to gear up:
Tool Mastery | Optimization
Article: Beginners Guide To Alteryx Optimization
Help Documentation: Optimization Tool
Source: The dataset was modified to align with the learning objectives of the challenge. https://www.kaggle.com/datasets/maharshipandya/-spotify-tracks-dataset
Good luck!
... View more
A solution to last week’s challenge can be found here.
This challenge comes to us from @The_Rad_Valentina Thank you for your contribution, Valentina!
Ever wondered how the prices of various products are determined in your thrift store? Well, it all depends on their condition and other factors. Thankfully, your local store has a database that handles this, but there is a slight hiccup—the database contains a single column (Payload) with all this data. To address this, you have been tasked with creating a report that showcases the following details:
Different condition types of the products
Record number associated with each condition
Material numbers corresponding to the products
Pricing rate for different condition types
Dates when these pricing rates were valid (valid from and valid to)
The challenge lies in parsing the information from the Payload column to create a comprehensive report listing each price on a separate line.
Hint: Some Price records have more than one condition type. For example:
This is an example of the report:
... View more