Weekly Challenges
Solve the challenge, share your solution and summit the ranks of our Community!Also available in | Français | Português | Español | 日本語
IDEAS WANTED
Want to get involved? We're always looking for ideas and content for Weekly Challenges.
SUBMIT YOUR IDEA- Community
- :
- Community
- :
- Learn
- :
- Academy
- :
- Challenges & Quests
- :
- Weekly Challenges
- :
- Re: Challenge #124: Air Transport Network Analysis
Challenge #124: Air Transport Network Analysis
- Subscribe to RSS Feed
- Mark Topic as New
- Mark Topic as Read
- Float this Topic for Current User
- Bookmark
- Subscribe
- Mute
- Printer Friendly Page
- Mark as New
- Bookmark
- Subscribe
- Mute
- Subscribe to RSS Feed
- Permalink
- Notify Moderator
Last week's solution is HERE.
This week, we are focused on learning a tool! The network analysis tool! The configuration is quite simple - the most challenging part will be prepping and structuring data for the tool itself.
For this week's challenge, the data given makes up two files - routes flown by planes and airport information. Create a network analysis visualization of all domestic (source and destination) flights in the United States (or country of choice) using the aforementioned files. Note that when interactive visualizations of the network analysis tools are clicked, there may be long render times based on data volume. For beginners, simply just visualize the top 100 records, for people who want take it a step further, analyze all airports in the network analysis tool, and then re-visualize the top most trafficked airport (>=500 degrees). From there, as long as the source or destination airport is in the route, then put it in the visualization. Look for ~279 airports.
- Mark as New
- Bookmark
- Subscribe
- Mute
- Subscribe to RSS Feed
- Permalink
- Notify Moderator
I couldn't convince my computer to render it. Perhaps I took a wrong step somewhere...

Here is the smallest of the 5 (Los Angeles). This picture isn't capturing the fact that these dots are buzzing around all over the place.

When I opened it up to all 5, the picture wouldn't render.
- Mark as New
- Bookmark
- Subscribe
- Mute
- Subscribe to RSS Feed
- Permalink
- Notify Moderator
- Mark as New
- Bookmark
- Subscribe
- Mute
- Subscribe to RSS Feed
- Permalink
- Notify Moderator
So, definitely not pretty. First time using any R tools, so it took a little investigating and t&e.
- Mark as New
- Bookmark
- Subscribe
- Mute
- Subscribe to RSS Feed
- Permalink
- Notify Moderator
- Mark as New
- Bookmark
- Subscribe
- Mute
- Subscribe to RSS Feed
- Permalink
- Notify Moderator
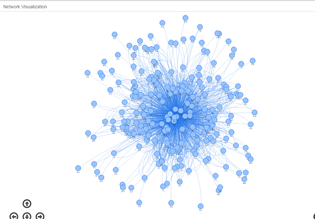
This is one of those exercises where it was trial and error and repeat, trial and error and repeat again (and again and again and again....). I really wanted to understand what it was doing and how to set it up. Super-gratifying when it came in at the ~279 airports (I got 278).
To top it off - it rendered!
- Mark as New
- Bookmark
- Subscribe
- Mute
- Subscribe to RSS Feed
- Permalink
- Notify Moderator
I just couldn't get the United States network to render, so I chose Norway. I hear it is beautiful there; maybe I will fly there from SAN someday. :)
- Mark as New
- Bookmark
- Subscribe
- Mute
- Subscribe to RSS Feed
- Permalink
- Notify Moderator
- Mark as New
- Bookmark
- Subscribe
- Mute
- Subscribe to RSS Feed
- Permalink
- Notify Moderator
- Mark as New
- Bookmark
- Subscribe
- Mute
- Subscribe to RSS Feed
- Permalink
- Notify Moderator
-
Advanced
284 -
Apps
25 -
Basic
143 -
Calgary
1 -
Core
136 -
Data Analysis
185 -
Data Cleansing
6 -
Data Investigation
7 -
Data Parsing
12 -
Data Preparation
213 -
Developer
35 -
Difficult
77 -
Expert
16 -
Foundation
13 -
Interface
39 -
Intermediate
251 -
Join
206 -
Macros
53 -
Parse
140 -
Predictive
20 -
Predictive Analysis
14 -
Preparation
272 -
Reporting
54 -
Reporting and Visualization
17 -
Spatial
60 -
Spatial Analysis
52 -
Time Series
1 -
Transform
218
- « Previous
- Next »


