Search
Close
Free Trial
Turn on suggestions
Auto-suggest helps you quickly narrow down your search results by suggesting possible matches as you type.
Showing results for
Weekly Challenges
Solve the challenge, share your solution and summit the ranks of our Community!Also available in | Français | Português | Español | 日本語
IDEAS WANTED
Want to get involved? We're always looking for ideas and content for Weekly Challenges.
SUBMIT YOUR IDEA- Community
- :
- Community
- :
- Learn
- :
- Academy
- :
- Challenges & Quests
- :
- Weekly Challenges
- :
- Re: Challenge #107: Plot Employment Rates by Gende...
Challenge #107: Plot Employment Rates by Gender in the US
Options
- Subscribe to RSS Feed
- Mark Topic as New
- Mark Topic as Read
- Float this Topic for Current User
- Bookmark
- Subscribe
- Mute
- Printer Friendly Page
Falk
5 - Atom
03-23-2018
04:13 AM
- Mark as New
- Bookmark
- Subscribe
- Mute
- Subscribe to RSS Feed
- Permalink
- Notify Moderator
Inactive User
Not applicable
03-27-2018
09:39 PM
- Mark as New
- Bookmark
- Subscribe
- Mute
- Subscribe to RSS Feed
- Permalink
- Notify Moderator
KM
6 - Meteoroid
03-29-2018
02:19 AM
- Mark as New
- Bookmark
- Subscribe
- Mute
- Subscribe to RSS Feed
- Permalink
- Notify Moderator
ACE Emeritus
03-30-2018
08:44 AM
- Mark as New
- Bookmark
- Subscribe
- Mute
- Subscribe to RSS Feed
- Permalink
- Notify Moderator
LordNeilLord
15 - Aurora
04-02-2018
03:51 AM
- Mark as New
- Bookmark
- Subscribe
- Mute
- Subscribe to RSS Feed
- Permalink
- Notify Moderator
15 - Aurora
04-03-2018
07:02 PM
- Mark as New
- Bookmark
- Subscribe
- Mute
- Subscribe to RSS Feed
- Permalink
- Notify Moderator
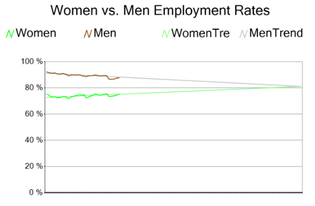
Still working on the advanced piece. I was able to render it out in Tableau, using the Forecasting tool.
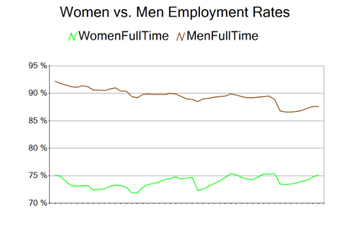
My solution, taking advantage of the dynamic tools to choose the columns and rename them.
TerryT
Alteryx Alumni (Retired)
04-12-2018
09:20 AM
- Mark as New
- Bookmark
- Subscribe
- Mute
- Subscribe to RSS Feed
- Permalink
- Notify Moderator
Thanks @JohnPo for showing me the "Model Coefficients" gallery tool (https://gallery.alteryx.com/#!app/Model-Coefficients/56bcd989a248970ce0ba08be)
My data show a crossover year of 2123.
terry10
12 - Quasar
05-25-2018
07:21 PM
- Mark as New
- Bookmark
- Subscribe
- Mute
- Subscribe to RSS Feed
- Permalink
- Notify Moderator
17 - Castor
05-28-2018
04:55 AM
- Mark as New
- Bookmark
- Subscribe
- Mute
- Subscribe to RSS Feed
- Permalink
- Notify Moderator
Struggled with the extrapolation piece, but @PhilipMannering solution gave me an excuse to use the R tool for the first time (thanks Philip)
Intersection around the year 2136 or so
StevenBetts
8 - Asteroid
06-26-2018
03:30 AM
- Mark as New
- Bookmark
- Subscribe
- Mute
- Subscribe to RSS Feed
- Permalink
- Notify Moderator
Labels
-
Advanced
284 -
Apps
25 -
Basic
143 -
Calgary
1 -
Core
136 -
Data Analysis
185 -
Data Cleansing
6 -
Data Investigation
7 -
Data Parsing
12 -
Data Preparation
213 -
Developer
35 -
Difficult
77 -
Expert
16 -
Foundation
13 -
Interface
39 -
Intermediate
251 -
Join
206 -
Macros
53 -
Parse
140 -
Predictive
20 -
Predictive Analysis
14 -
Preparation
272 -
Reporting
54 -
Reporting and Visualization
17 -
Spatial
60 -
Spatial Analysis
52 -
Time Series
1 -
Transform
218
- « Previous
- Next »


