Tool Mastery
Explore a diverse compilation of articles that take an in-depth look at Designer tools.- Community
- :
- Community
- :
- Learn
- :
- Academy
- :
- Tool Mastery
- :
- Tool Mastery | Logistic Regression
Tool Mastery | Logistic Regression
- Subscribe to RSS Feed
- Mark as New
- Mark as Read
- Bookmark
- Subscribe
- Printer Friendly Page
- Notify Moderator
on
05-09-2018
09:36 AM
- edited on
03-08-2019
12:07 PM
by
Community_Admin

This article is part of the Tool Mastery Series, a compilation of Knowledge Base contributions to introduce diverse working examples for Designer Tools. Here we’ll delve into uses of the Logistic Regression Tool on our way to mastering the Alteryx Designer:
As many of you know, Logistic regression can be applied to a variable with two possible outcomes. It creates a model that relates a binary target variable (such as a 0/1 or Yes/No) to one or more predictor variables and obtains the estimated probability for each of the two possible outcomes. Logistic Regression is different from other types of regression because it creates predictions within a range of 0-1 and it does not assume that the predictor variables have a constant marginal effect on the target variable, making it appropriate for dichotomous target variables (one that has only two possible values).
Logistic regression can be applied to many problems, including: estimating the probability that a student will graduate, the probability that a voter will vote for a specific candidate, or the probability that someone will respond to a marketing campaign.
Aa a side note, before building a statistical model, you should always perform a thorough analysis of your data, and the Data Investigation Tool Series provides a great resource to begin your pre-model analysis. Once a pre-model analysis has been performed, you can begin building your model and can focus on the details of the Logistic Regression Tool.
We will walk through the configuration of the Logistic Regression Tool using the sample workflow that can be found within Designer:
Help > Sample Workflows > Predictive tool samples > Predictive Analytics > 9 Logistic Regression
Setup Screen
- The first step is to connect your data, which should include your target variable and one or more predictor variables, to the Logistic Regression Tool.
- The next step is to provide a name for the model (optional), select the target field, and select the predictor variables. This can be done in the Setup window.
Customization Screen
The customization screen can be reached from the setup screen.
A. Model Screen
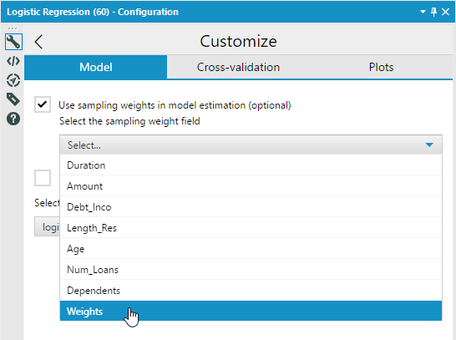
Note: The Model screen has three customizable options for building a logistic model (Use sampling weights, Use regularized regression, and Select model type).
- The “Use sampling weights” option allows you to specify a field that contains sampling weights. This option can be used to standardize sample data (survey data) so that it better represents a population
- Regularized Regression allows you to mitigate over-fitting (e.g., preventing your model from being fit to the “noise” in your data). This method will generate its own density curve, and is discussed in further detail in this article. The Use regularized regression option contains four customizable options:
I. Enter value of alpha
II. Standardize predictor variables
III. Use cross-validation to determine model parameters
IV. Value of Lambda used for predictions
- If you do not select Use regularized regression, you can select a model type from a drop-down menu. Your options are logit, probit, or complementary log-log (cloglog). Different models will be better suited for different use cases. You can learn more about model selection from this article.
B. Cross-validation Screen
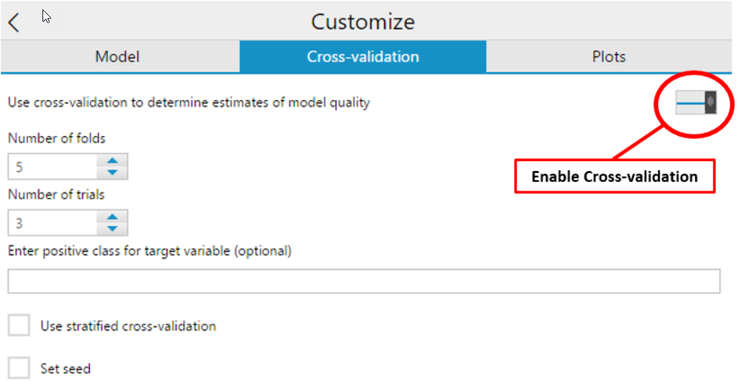
The Cross-Validation tab allows you to perform cross-validation in your model. The cross-validation option can be enabled by clicking on the slider in the top-right of the configuration screen. You can learn more about Cross-validation from this article.
C. Plots Screen
The plots screen allows the user to choose Graph resolution. There are 3 options:
- 1x (96 dpi)
- 2x (192 dpi)
- 3x (288 dpi)
Now you know how to configure the tool, let’s look at interpreting the results. The tool has 3 outputs:
O (Output): Displays the model name and size – this outputs the actual model object. You can connect this output to the Score Tool, which generates a predicted value (score) from a separate data stream.
R (Report): Generates a report with the fit statistics for the model. In general, there are 3 major fit statistics that are generated with this output.
I (Interactive): Displays the dashboard with various statistics about the data such as actual positive and actual negative.
That’s it folks, now you should be an expert on the Logistic Regression Tool!
Alteryx has a wide variety of kits where you can learn various subjects. The Predictive Starter Kit provides step-by-step tutorials that will teach you how to build core predictive insights, from developing a proper dataset to analyzing the results without requiring niche tools or R-coding.
By now, you should have expert-level proficiency with the Logistic Regression Tool! If you can think of a use case we left out, feel free to use the comments section below! Consider yourself a Tool Master already? Let us know at community@alteryx.com if you’d like your creative tool uses to be featured in the Tool Mastery Series.
Stay tuned with our latest posts every Tool Tuesday by following Alteryx on Twitter! If you want to master all the Designer tools, consider subscribing for email notifications.
- Mark as Read
- Mark as New
- Bookmark
- Permalink
- Notify Moderator
How do I select the value of the target variable? I have 0 and 1 for the target, is the logistic regression tool trying to reach 0 or 1?
- Mark as Read
- Mark as New
- Bookmark
- Permalink
- Notify Moderator
How does this tool handle different data types?
For example, in the included workflow the data has strings as well as continuous variables (age). When using logistic regression previous I am sure I had to mess around with the data a lot. In Alteryx, is there some sort of background use of dummy variables or something?
-
2018.3
1 -
API
2 -
Apps
7 -
AWS
1 -
Configuration
3 -
Connector
3 -
Data Investigation
10 -
Database Connection
2 -
Date Time
4 -
Designer
1 -
Desktop Automation
1 -
Developer
8 -
Documentation
3 -
Dynamic Processing
10 -
Error
4 -
Expression
6 -
FTP
1 -
Fuzzy Match
1 -
In-DB
1 -
Input
6 -
Interface
7 -
Join
7 -
Licensing
2 -
Macros
7 -
Output
2 -
Parse
3 -
Predictive
16 -
Preparation
16 -
Prescriptive
1 -
Python
1 -
R
2 -
RegEx
1 -
Reporting
12 -
Run Command
1 -
Spatial
6 -
Tips + Tricks
2 -
Tool Mastery
99 -
Transformation
6 -
Visualytics
1
- « Previous
- Next »


