Engine Works
Under the hood of Alteryx: tips, tricks and how-tos.- Community
- :
- Community
- :
- Learn
- :
- Blogs
- :
- Engine Works
- :
- How Powerful Is Alteryx?
- Subscribe to RSS Feed
- Mark as New
- Mark as Read
- Bookmark
- Subscribe
- Printer Friendly Page
- Notify Moderator
The Perfect Use-Case
Have you ever run into a situation where you have nearly created the perfect workflow, but you are simply missing one tool to put your vision together? How about when you have to download a dataset from an unsupported connector before you bring it into your workflow? Then you likely haven’t heard of Alteryx’s Platform Software Development Kit (SDK). The SDK version two uses a CLI to create a packaged tool that allows developers to code with python in the backend and create a UI with react on the front end. All to create their very own tool that can serve whatever use cases that can be imagined: from data connectors to all types of API calls to workflow simplifications and advanced math. These are just a few of the many tools that can be built using the Platform SDK. With the Platform SDK, Alteryx has created a scalable and performant product with the goal of fulfilling all customer’s needs.
The Perfect Workflow
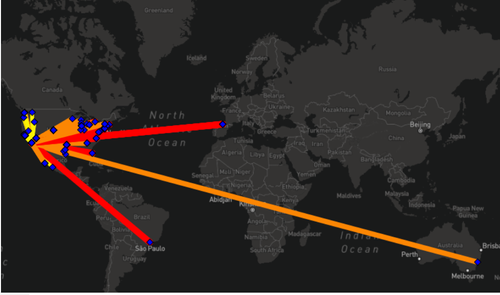
Not too long ago, while presenting at an Alteryx Analytics data workshop for Earth Month, I had envisioned a spatial workflow that would be able to not only display a visual report of our travel as a company for the sake of environmental awareness but at the same time demonstrate the power of Alteryx’s spatial tools. I pulled the prepped and transformed data from a previous workflow demoed during the session. The dataset contained all flights' total distances, emissions, and location information, such as cities, countries, and airports. To someone unfamiliar with Alteryx’s spatial tools, this would seem like more than enough to run spatial analysis, but for those familiar with our product, the most important thing needed to do spatial analysis are… geographic coordinates. Now not many datasets with location data come equipped with Longitude and Latitude points already in them. So, to do any sort of analysis, you would need to go and convert spatial strings into coordinates so one can begin to plot points.
There are a few ways to do this, such as if you have access to Alteryx’s geo-datasets and you use the address tool, but your location data will need to be in a standardized format. Secondly, if you have zip codes, you could take your dataset to Tableau, and it will create those points for you. However, in my case, I took the easy way and went to Kaggle to grab coordinates for only one of my columns, the countries column, as it was the simplest one to produce any sort of points for me. With this, I was able to demonstrate my findings for the workshop and show off Alteryx’s geospatial analysis.
But at the back of my mind, I always wish I could have gone deeper, further into the analysis…
The Perfect Tool
… step 4 months into the future, and I join the Platform SDK team. One of my first tasks was to get familiar with the product. I was tasked with creating my own tool on Alteryx. The question was, what was it going to be? After a little time thinking and jumping from idea to idea, it struck me. I had been puzzling over the months about the same situation I’d run into during the workshop. Is there a way to convert a string of geospatial data to coordinate points? Following some time on Google, I learned about the wonderful world of reverse geocoding. Google maps platform API offered a variety of services on their portfolio, and one was the ability to turn any spatial search into a full address, including geo coordinates. After being on the extensibility team for a while, I knew…
“Anything that can be done on the Internet can be used on Alteryx”
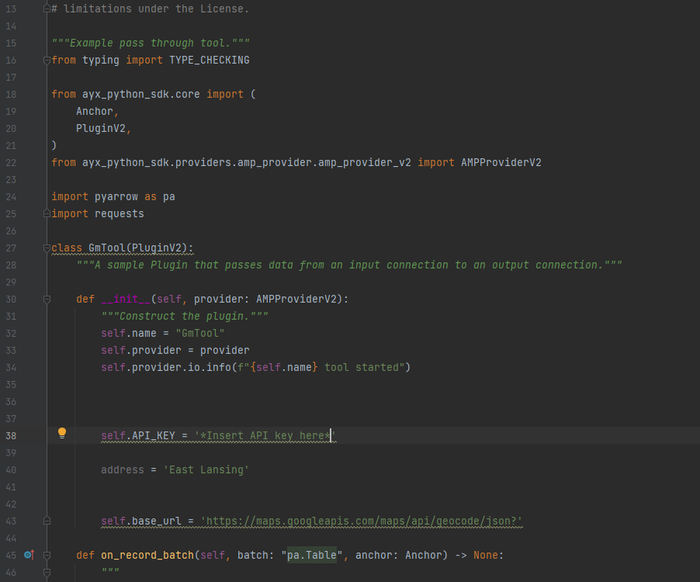
import requests

API_KEY = 'Insert API Key here'

address = 'Insert chosen Address here'

params = {
    'key' : API_KEY,
    'address' : address
}

base_url ='https://maps.googleapis.com/maps/api/geocode/json?'
response = requests.get(base_url, params=params).json()
response.keys()

if response['status'] == 'OK':
    geometry = response['results'][0]['geometry']
    lat = geometry['location']['lat']
    lon = geometry['location']['lng']

print(lat, lon)

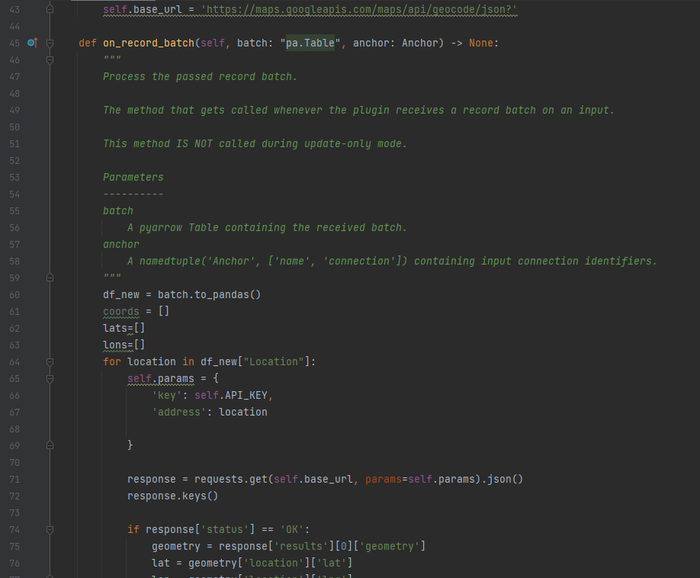
df_new = batch.to_pandas()
        self.params = {
            'key': self.API_KEY,
            'address': df_new["Location"][0]
        }
So now, I had my tool. I went to YouTube to learn more about coding python with the google maps API and stumbled across the perfect video. It took 20 lines of code, and I now had the engineering power of Google maps. All I needed to do now was to transfer my 20 lines of code into the platform SDK scaffolding, and I would have my tool.
I am the first to say my knowledge of Python is not world-class, but with the Platform SDK, all you need is to understand your code and understand where it fits in the scaffolding. With the help of the engineers from my team who helped me fit my code into the scaffolding, I now had my dream tool. That, combined with a remake of my earlier workflow, allowed me to realize the vision I had.
Not only was I able to keep all my work in Alteryx, but I was able to convert not just countries or cities but even points of interest such as airports allowing me to do detailed geospatial analysis.
The Perfect Product
The aim of this exchange was to create awareness about how capable Alteryx is with the extensibility of the Platform SDK. Alteryx is a no-code software aimed at the analyst; however, even in our developer experience, the product still provides the easiest way to create powerful outcomes. First, it was the Democratization of Analytics, and now it’s the Democratization of the Developer Experience.
A huge thank you to Aneesh Nazar (@aneeshnazar), Verlon Smith (@VerlonS) & Derek Andreis (@dandreis)
Resources:
- For more information on the SDK, visit the Platform SDK Quick Start Guide
- Here is a link to the tool shown in this blog
- To get in contact with our team, be sure to reach out to devex@alteryx.com.
You must be a registered user to add a comment. If you've already registered, sign in. Otherwise, register and sign in.


