Data Science
Machine learning & data science for beginners and experts alike.- Community
- :
- Community
- :
- Learn
- :
- Blogs
- :
- Data Science
- :
- Machine Learning for the Data Analyst
- Subscribe to RSS Feed
- Mark as New
- Mark as Read
- Bookmark
- Subscribe
- Printer Friendly Page
- Notify Moderator
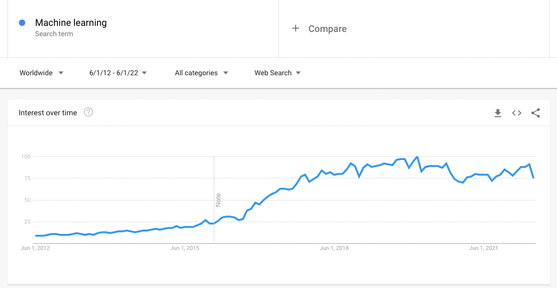
In the last ten years, “machine learning” (ML) has increased in popularity as a search term on Google. The chart below illustrates the interest relative to peak interest. Since around 2018, the data shows that people worldwide want to know more about machine learning.
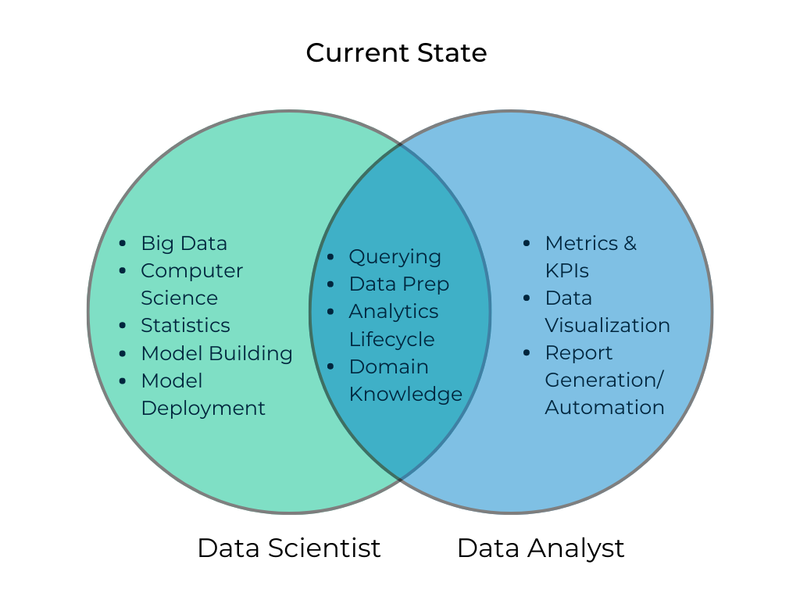
But… isn’t machine learning for data scientists? Historically, ML has required formal education in data science or a combo of statistics and computer science. The graphic below summarizes how I have thought about the similarities and differences between data scientists and data analysts.
There is lots of overlap in the data cleaning realm—no matter your destination, the data must be good to have meaningful results. Of course, not every company has the same distinctions between these positions. It is helpful to outline generally in this visual because then we can look at what an up-skilled data analyst can look like.
Ta-da! With Alteryx Machine Learning, predictive modeling and deployment are accessible to the data analyst. Data analysts can now gain more insights from their data and deliver more business impact on projects. Sounds great, right? If you think so too, then keep on reading. This blog post will cover why Alteryx ML is ideal for data analysts beginning their advanced analytics & modeling journey.
Education Mode
Education Mode is my favorite part of Alteryx ML. It makes machine learning accessible by providing thorough explanations for every step. If you are on a screen and do not understand the options, data, or results, click on the book icon on the top right of the screen.
The explainability of machine learning is essential to get buy-in from your organization on implementing models. This can be a challenge when you first start creating models—if you are still working on understanding what is happening behind the scenes, how can you explain it to others? This is another valuable use case for Education Mode. If you do not know what an XGBoost regressor is and that model Alteryx ML indicates that is the best model for your data, you can turn to the Education Mode panel to understand what the model is and why it was selected.
No-Code GUI
If you were hired as a data analyst, you probably were not expecting to write Python scripts to train machine learning models. Understandable. But wouldn’t it be great to leverage ML's productivity & accuracy gains without knowing anything about computer science? With the excellent no-code user interface of Alteryx ML, you can.
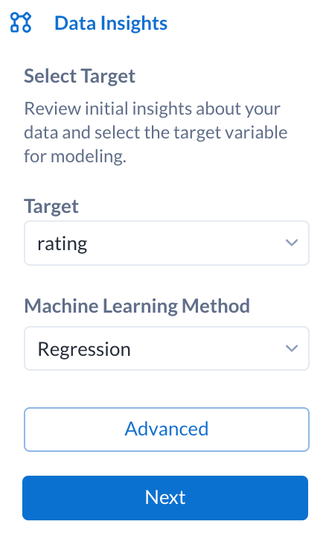
For example, choosing your target variable and method for machine learning is done with a drop-down selection. And information that you need to inform your modeling is automatically generated.
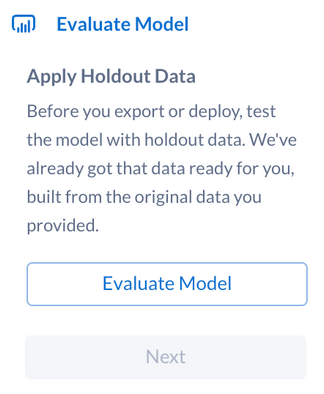
Want to evaluate the model that Alteryx ML selected for you? Easy—just press a button.
Once you have a model that performed well on training and test data, you can export the model to a .yxmd file and continue your no-code journey in a product you are familiar with—Alteryx Designer.
Visuals
Ok, time to nerd out about charts for a second! As a former data analyst who dabbles in data science, I did not enjoy creating graphs in Python because the default charts are not very visually appealing. And it sometimes takes a decent amount of code or trying new packages to get the charts and the look you want. The charts in Alteryx ML, on the other hand, are auto-generated and visually appealing. Also, they are presented at the right time to help you make modeling selections.
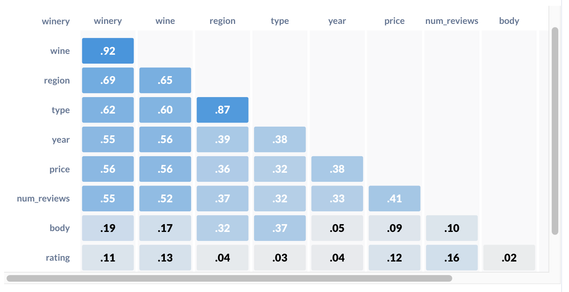
In the Data Insights section, the correlation matrix can help you spot target leakage, unhelpful features, and redundant features. Not sure what those terms mean? No worries—the how-to section in Education Mode explains what to check in the chart and why.
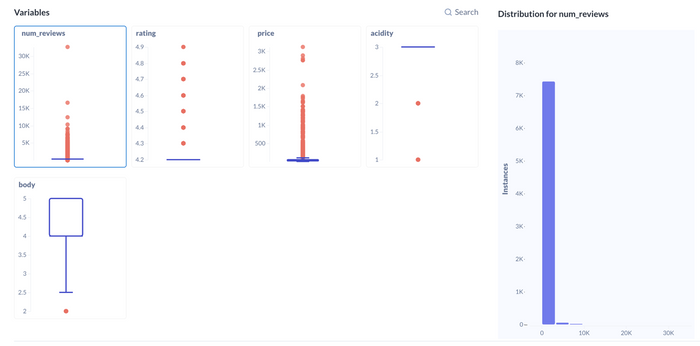
There are more great charts on the Outliers tab of the Data Insights section. The visuals are dynamic—you can click on a box plot to show the histogram distribution on the right. These can help you understand the distribution of your variables, the prevalence of outliers, and identify if there are any variables or records that should be excluded.
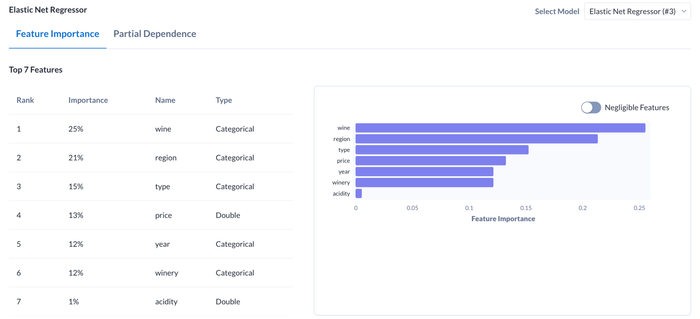
Finally, the Insights tab in the Evaluate Model section has a nice chart on feature importance (in addition to a tabular view of your top features). You can even choose to view the negligible features with a toggle button. So, when stakeholders come to you with questions on what most affects your target variable, you have the answers right here.
Conclusion
Alteryx Machine Learning’s Education Mode, No-Code GUI, and Visuals make it an excellent tool for data science newbies. It can help upskill the data analysts at your organization and come in handy if your data science team is overloaded. If you would like to request a demo of the software, you fill out this form.
If you already have Alteryx ML or want to learn a bit before diving in, the Academy section of Community has interactive lessons for the product. Additionally, check out this blog post for a step-by-step walkthrough of an Alteryx Machine Learning platform example.
Happy (machine) learning!

Sr. Content Manager
Hi, I'm Megan! I am a Sr. Content Manager at Alteryx. I work to make sure our blogs and podcast have high quality, helpful, and engaging content. As a data analyst turned writer, I am passionate about making analytics & data science accessible (and fun) for all. If there is content that you think the community is missing, feel free to message me--I would love to hear about it.
Hi, I'm Megan! I am a Sr. Content Manager at Alteryx. I work to make sure our blogs and podcast have high quality, helpful, and engaging content. As a data analyst turned writer, I am passionate about making analytics & data science accessible (and fun) for all. If there is content that you think the community is missing, feel free to message me--I would love to hear about it.
You must be a registered user to add a comment. If you've already registered, sign in. Otherwise, register and sign in.
