Alteryx Designer Desktop Discussions
Find answers, ask questions, and share expertise about Alteryx Designer Desktop and Intelligence Suite.- Community
- :
- Community
- :
- Participate
- :
- Discussions
- :
- Designer Desktop
- :
- Urgent : Linear Regression tool error : The field ...
Urgent : Linear Regression tool error : The field fit stats is not contained in the record
- Subscribe to RSS Feed
- Mark Topic as New
- Mark Topic as Read
- Float this Topic for Current User
- Bookmark
- Subscribe
- Mute
- Printer Friendly Page
- Mark as New
- Bookmark
- Subscribe
- Mute
- Subscribe to RSS Feed
- Permalink
- Notify Moderator
Hi All,
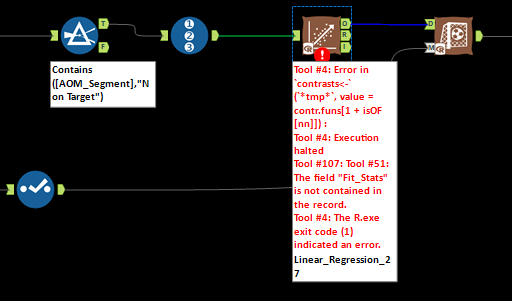
Am trying to run linear regression. When i run the flow, am getting an error as attached shown screen shot Saying " Fit Stats is not contained in the record", Can someone help me diagnose this.

Thank you.
Br,
Anil
Solved! Go to Solution.
- Labels:
-
Predictive Analysis

- Mark as New
- Bookmark
- Subscribe
- Mute
- Subscribe to RSS Feed
- Permalink
- Notify Moderator
Hi Roland,
Thank you for your input.
When i try to forecast and look at the forecast values, the values same for different periods as attached. Can you please let me know what causes this? I can see a same problem where people are facing in different threads, but i dont see any solution there. Can you please throw some light on this.
Thank you.
Br,
Anil
- Mark as New
- Bookmark
- Subscribe
- Mute
- Subscribe to RSS Feed
- Permalink
- Notify Moderator
Hi Anil,
I could not analyze data in detail, but it seems, data provided for previous periods do not show a clear seasonality. I've added a TS Plot tool to the workflow, I think, it's helpful to analyze the results.
If you select some of the territory-segment-combinations, you'll usually find a pattern ike that (Browse tool attached to the "I" anchor):

The autocorrelation plot looks like this:

As you see, correlation between a period and a previous period decreases - even if it increases slightly, it shows no "seasonal pattern", which would look like this:

As there is no "seasonal pattern", changes are considered to be "remainder" (i.e. "error" or "random"). In addition, you'll so no long term trend, this leads to a more or less flat forecast.
Do you expect a seasonal pattern?
Best,
Roland
- Mark as New
- Bookmark
- Subscribe
- Mute
- Subscribe to RSS Feed
- Permalink
- Notify Moderator
Hi Roland,
Yes, We have 3 levels of area splits i.,e Region, District and Territory. For example 1 region will have 5 districts and each district will have 7 territories and each territory will have 5 segments like Tier 1, 2,3,4 and 5 ., When we see the data on segments, i don't see a seasonality but when i look at the data on territories, i see a seasonality. Basically, summing all segments will give a territory data which is showing a seasonality.
But why will the segment data which has a variable trend in the past when forecast is constant?
Br,
Anil
- Mark as New
- Bookmark
- Subscribe
- Mute
- Subscribe to RSS Feed
- Permalink
- Notify Moderator
Hi Anil,
I see your problem ... unfortunately, the tool evaluates on territory-segment resulting in no seasonality and variance is considered to be random. The result is a flat forecast (no seasonality, no clear trend, all variance random => average forecast).
I would try to perform the process on territory (this should result in seasonality) and then allocate the result (total territory) to the segments by monthly shares last year or average share for last 3 years. What do you think?
Best,
Roland
- Mark as New
- Bookmark
- Subscribe
- Mute
- Subscribe to RSS Feed
- Permalink
- Notify Moderator
Hi Roland,
Its seems, i don't have an option other than doing that on territory and then considering percentage of business on segments on historical data and splitting based on average of historical data.
But problem is, if i average out at segments, that does not give a full picture because each year volumes from different segments are driven by various business drivers. I have to find some critical drivers and quantify them and do a weighted percentage allocations and then split the forecast.
Let me do it on total territory level forecast and see how my forecast look like.
Br,
Anil
- « Previous
-
- 1
- 2
- Next »

-
AAH
1 -
AAH Welcome
2 -
Academy
24 -
ADAPT
82 -
Add column
1 -
Administration
20 -
Adobe
176 -
Advanced Analytics
1 -
Advent of Code
5 -
Alias Manager
70 -
Alteryx
1 -
Alteryx 2020.1
3 -
Alteryx Academy
3 -
Alteryx Analytics
1 -
Alteryx Analytics Hub
2 -
Alteryx Community Introduction - MSA student at CSUF
1 -
Alteryx Connect
1 -
Alteryx Designer
44 -
Alteryx Engine
1 -
Alteryx Gallery
1 -
Alteryx Hub
1 -
alteryx open source
1 -
Alteryx Post response
1 -
Alteryx Practice
134 -
Alteryx team
1 -
Alteryx Tools
1 -
AlteryxForGood
1 -
Amazon s3
138 -
AMP Engine
191 -
ANALYSTE INNOVATEUR
1 -
Analytic App Support
1 -
Analytic Apps
17 -
Analytic Apps ACT
1 -
Analytics
2 -
Analyzer
17 -
Announcement
4 -
API
1,040 -
App
1 -
App Builder
43 -
Append Fields
1 -
Apps
1,168 -
Archiving process
1 -
ARIMA
1 -
Assigning metadata to CSV
1 -
Authentication
4 -
Automatic Update
1 -
Automating
3 -
Banking
1 -
Base64Encoding
1 -
Basic Table Reporting
1 -
Batch Macro
1,274 -
Beginner
1 -
Behavior Analysis
219 -
Best Practices
2,416 -
BI + Analytics + Data Science
1 -
Book Worm
2 -
Bug
623 -
Bugs & Issues
2 -
Calgary
59 -
CASS
46 -
Cat Person
1 -
Category Documentation
1 -
Category Input Output
2 -
Certification
4 -
Chained App
235 -
Challenge
7 -
Charting
1 -
Clients
3 -
Clustering
1 -
Common Use Cases
3,392 -
Communications
1 -
Community
188 -
Computer Vision
46 -
Concatenate
1 -
Conditional Column
1 -
Conditional statement
1 -
CONNECT AND SOLVE
1 -
Connecting
6 -
Connectors
1,182 -
Content Management
8 -
Contest
6 -
Conversation Starter
17 -
copy
1 -
COVID-19
4 -
Create a new spreadsheet by using exising data set
1 -
Credential Management
3 -
Curious*Little
1 -
Custom Formula Function
1 -
Custom Tools
1,725 -
Dash Board Creation
1 -
Data Analyse
1 -
Data Analysis
2 -
Data Analytics
1 -
Data Challenge
83 -
Data Cleansing
4 -
Data Connection
1 -
Data Investigation
3,067 -
Data Load
1 -
Data Science
38 -
Database Connection
1,900 -
Database Connections
5 -
Datasets
4,582 -
Date
3 -
Date and Time
3 -
date format
2 -
Date selection
2 -
Date Time
2,887 -
Dateformat
1 -
dates
1 -
datetimeparse
2 -
Defect
2 -
Demographic Analysis
173 -
Designer
1 -
Designer Cloud
475 -
Designer Integration
60 -
Developer
3,649 -
Developer Tools
2,925 -
Discussion
2 -
Documentation
455 -
Dog Person
4 -
Download
908 -
Duplicates rows
1 -
Duplicating rows
1 -
Dynamic
1 -
Dynamic Input
1 -
Dynamic Name
1 -
Dynamic Processing
2,543 -
dynamic replace
1 -
dynamically create tables for input files
1 -
Dynamically select column from excel
1 -
Email
743 -
Email Notification
1 -
Email Tool
2 -
Embed
1 -
embedded
1 -
Engine
129 -
Enhancement
3 -
Enhancements
2 -
Error Message
1,980 -
Error Messages
6 -
ETS
1 -
Events
178 -
Excel
1 -
Excel dynamically merge
1 -
Excel Macro
1 -
Excel Users
1 -
Explorer
2 -
Expression
1,698 -
extract data
1 -
Feature Request
1 -
Filter
1 -
filter join
1 -
Financial Services
1 -
Foodie
2 -
Formula
2 -
formula or filter
1 -
Formula Tool
4 -
Formulas
2 -
Fun
4 -
Fuzzy Match
615 -
Fuzzy Matching
1 -
Gallery
591 -
General
93 -
General Suggestion
1 -
Generate Row and Multi-Row Formulas
1 -
Generate Rows
1 -
Getting Started
1 -
Google Analytics
140 -
grouping
1 -
Guidelines
11 -
Hello Everyone !
2 -
Help
4,118 -
How do I colour fields in a row based on a value in another column
1 -
How-To
1 -
Hub 20.4
2 -
I am new to Alteryx.
1 -
identifier
1 -
In Database
856 -
In-Database
1 -
Input
3,718 -
Input data
2 -
Inserting New Rows
1 -
Install
3 -
Installation
305 -
Interface
2 -
Interface Tools
1,648 -
Introduction
5 -
Iterative Macro
952 -
Jira connector
1 -
Join
1,739 -
knowledge base
1 -
Licenses
1 -
Licensing
210 -
List Runner
1 -
Loaders
12 -
Loaders SDK
1 -
Location Optimizer
52 -
Lookup
1 -
Machine Learning
230 -
Macro
2 -
Macros
2,505 -
Mapping
1 -
Marketo
12 -
Marketplace
4 -
matching
1 -
Merging
1 -
MongoDB
66 -
Multiple variable creation
1 -
MultiRowFormula
1 -
Need assistance
1 -
need help :How find a specific string in the all the column of excel and return that clmn
1 -
Need help on Formula Tool
1 -
network
1 -
News
1 -
None of your Business
1 -
Numeric values not appearing
1 -
ODBC
1 -
Off-Topic
14 -
Office of Finance
1 -
Oil & Gas
1 -
Optimization
648 -
Output
4,513 -
Output Data
1 -
package
1 -
Parse
2,104 -
Pattern Matching
1 -
People Person
6 -
percentiles
1 -
Power BI
197 -
practice exercises
1 -
Predictive
2 -
Predictive Analysis
822 -
Predictive Analytics
1 -
Preparation
4,637 -
Prescriptive Analytics
186 -
Publish
230 -
Publishing
2 -
Python
728 -
Qlik
36 -
quartiles
1 -
query editor
1 -
Question
18 -
Questions
1 -
R Tool
452 -
refresh issue
1 -
RegEx
2,109 -
Remove column
1 -
Reporting
2,118 -
Resource
15 -
RestAPI
1 -
Role Management
3 -
Run Command
501 -
Run Workflows
10 -
Runtime
1 -
Salesforce
244 -
Sampling
1 -
Schedule Workflows
3 -
Scheduler
372 -
Scientist
1 -
Search
3 -
Search Feedback
20 -
Server
525 -
Settings
759 -
Setup & Configuration
47 -
Sharepoint
465 -
Sharing
2 -
Sharing & Reuse
1 -
Snowflake
1 -
Spatial
1 -
Spatial Analysis
559 -
Student
9 -
Styling Issue
1 -
Subtotal
1 -
System Administration
1 -
Tableau
462 -
Tables
1 -
Technology
1 -
Text Mining
412 -
Thumbnail
1 -
Thursday Thought
10 -
Time Series
397 -
Time Series Forecasting
1 -
Tips and Tricks
3,785 -
Tool Improvement
1 -
Topic of Interest
40 -
Transformation
3,216 -
Transforming
3 -
Transpose
1 -
Truncating number from a string
1 -
Twitter
24 -
Udacity
85 -
Unique
2 -
Unsure on approach
1 -
Update
1 -
Updates
2 -
Upgrades
1 -
URL
1 -
Use Cases
1 -
User Interface
21 -
User Management
4 -
Video
2 -
VideoID
1 -
Vlookup
1 -
Weekly Challenge
1 -
Weibull Distribution Weibull.Dist
1 -
Word count
1 -
Workflow
8,483 -
Workflows
1 -
YearFrac
1 -
YouTube
1 -
YTD and QTD
1
- « Previous
- Next »