Alteryx Designer Desktop Discussions
Find answers, ask questions, and share expertise about Alteryx Designer Desktop and Intelligence Suite.- Community
- :
- Community
- :
- Participate
- :
- Discussions
- :
- Designer Desktop
- :
- Display forecasted data from ARIMA
Display forecasted data from ARIMA
- Subscribe to RSS Feed
- Mark Topic as New
- Mark Topic as Read
- Float this Topic for Current User
- Bookmark
- Subscribe
- Mute
- Printer Friendly Page
- Mark as New
- Bookmark
- Subscribe
- Mute
- Subscribe to RSS Feed
- Permalink
- Notify Moderator
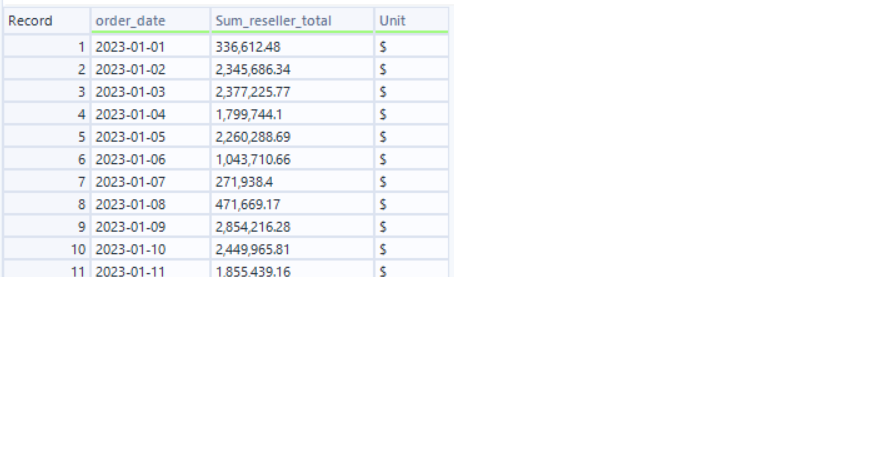
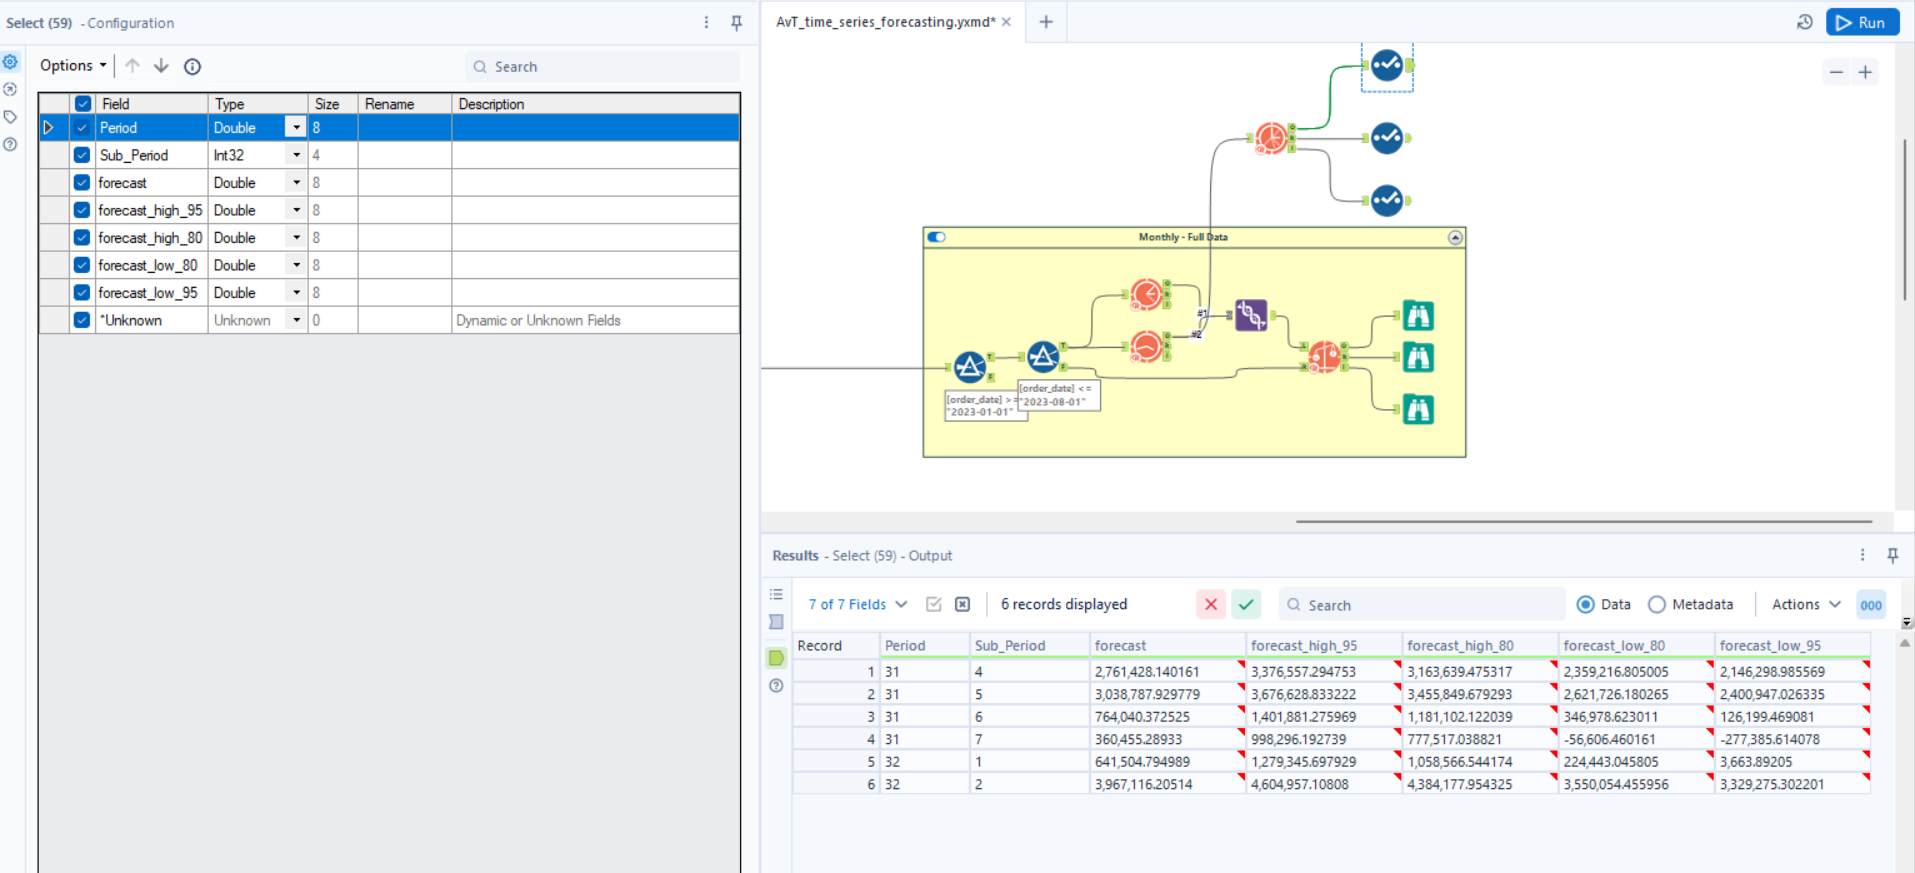
How do you get the data at the end of a forecasting tool displayed nicely in a table? The first picture is some of the incoming data, the second is the workflow and the output table. Also, why is the output only 6 records, how do I increase that?
Solved! Go to Solution.
- Labels:
-
Time Series

- Mark as New
- Bookmark
- Subscribe
- Mute
- Subscribe to RSS Feed
- Permalink
- Notify Moderator
You can increase the number of periods in the TS Forecast tool! The default is 6
Confused by the first question - if it is what I assume, you can rename some of the fields, get the max date from the data and use it to calculate the dates for the new table, and union it all together!
- Mark as New
- Bookmark
- Subscribe
- Mute
- Subscribe to RSS Feed
- Permalink
- Notify Moderator
Currently, the output looks like the second picture: Period (week of the year), sub period (day of the week), and then the forecast of that day + the confidence intervals. Is there a way to format the output to look like the first picture (the data input)?
- Mark as New
- Bookmark
- Subscribe
- Mute
- Subscribe to RSS Feed
- Permalink
- Notify Moderator
The suggestion above should work to get it in a format that you might need - the first period listed would be the next interval date in your data. For example, if your data end 2023-08-31, then this row would be 2023-09-01 and the other rows would be 09-02, 09-03, etc.
However, it's difficult for us to advise further because we don't know the configuration of your ARIMA tool - for example, is the interval daily? When is the last period of the data? Further context should help!
- Mark as New
- Bookmark
- Subscribe
- Mute
- Subscribe to RSS Feed
- Permalink
- Notify Moderator
The interval is daily, the data here is from January 1, 2023 to today's date. This is just a sample of the larger data that dates back to 2021, but I wanted to get this sample working first. Thanks!
- Mark as New
- Bookmark
- Subscribe
- Mute
- Subscribe to RSS Feed
- Permalink
- Notify Moderator
You could then use a DateTimeNow tool to get todays date, use the Generate Rows tool to create all of the dates corresponding to the number of periods you are forecasting out, and Join on Record Position. Without data I can't do much else, but this workflow should help get things started - good luck!


-
AAH
1 -
AAH Welcome
2 -
Academy
24 -
ADAPT
82 -
Add column
1 -
Administration
20 -
Adobe
177 -
Advanced Analytics
1 -
Advent of Code
5 -
Alias Manager
70 -
Alteryx
1 -
Alteryx 2020.1
3 -
Alteryx Academy
3 -
Alteryx Analytics
1 -
Alteryx Analytics Hub
2 -
Alteryx Community Introduction - MSA student at CSUF
1 -
Alteryx Connect
1 -
Alteryx Designer
44 -
Alteryx Engine
1 -
Alteryx Gallery
1 -
Alteryx Hub
1 -
alteryx open source
1 -
Alteryx Post response
1 -
Alteryx Practice
134 -
Alteryx team
1 -
Alteryx Tools
1 -
AlteryxForGood
1 -
Amazon s3
138 -
AMP Engine
191 -
ANALYSTE INNOVATEUR
1 -
Analytic App Support
1 -
Analytic Apps
17 -
Analytic Apps ACT
1 -
Analytics
2 -
Analyzer
17 -
Announcement
4 -
API
1,046 -
App
1 -
App Builder
43 -
Append Fields
1 -
Apps
1,168 -
Archiving process
1 -
ARIMA
1 -
Assigning metadata to CSV
1 -
Authentication
4 -
Automatic Update
1 -
Automating
3 -
Banking
1 -
Base64Encoding
1 -
Basic Table Reporting
1 -
Batch Macro
1,277 -
Beginner
1 -
Behavior Analysis
219 -
Best Practices
2,425 -
BI + Analytics + Data Science
1 -
Book Worm
2 -
Bug
625 -
Bugs & Issues
2 -
Calgary
59 -
CASS
46 -
Cat Person
1 -
Category Documentation
1 -
Category Input Output
2 -
Certification
4 -
Chained App
235 -
Challenge
7 -
Charting
1 -
Clients
3 -
Clustering
1 -
Common Use Cases
3,398 -
Communications
1 -
Community
188 -
Computer Vision
46 -
Concatenate
1 -
Conditional Column
1 -
Conditional statement
1 -
CONNECT AND SOLVE
1 -
Connecting
6 -
Connectors
1,188 -
Content Management
8 -
Contest
6 -
Conversation Starter
17 -
copy
1 -
COVID-19
4 -
Create a new spreadsheet by using exising data set
1 -
Credential Management
3 -
Curious*Little
1 -
Custom Formula Function
1 -
Custom Tools
1,727 -
Dash Board Creation
1 -
Data Analyse
1 -
Data Analysis
2 -
Data Analytics
1 -
Data Challenge
83 -
Data Cleansing
4 -
Data Connection
1 -
Data Investigation
3,076 -
Data Load
1 -
Data Science
38 -
Database Connection
1,903 -
Database Connections
5 -
Datasets
4,597 -
Date
3 -
Date and Time
3 -
date format
2 -
Date selection
2 -
Date Time
2,895 -
Dateformat
1 -
dates
1 -
datetimeparse
2 -
Defect
2 -
Demographic Analysis
173 -
Designer
1 -
Designer Cloud
487 -
Designer Integration
60 -
Developer
3,659 -
Developer Tools
2,936 -
Discussion
2 -
Documentation
455 -
Dog Person
4 -
Download
910 -
Duplicates rows
1 -
Duplicating rows
1 -
Dynamic
1 -
Dynamic Input
1 -
Dynamic Name
1 -
Dynamic Processing
2,550 -
dynamic replace
1 -
dynamically create tables for input files
1 -
Dynamically select column from excel
1 -
Email
747 -
Email Notification
1 -
Email Tool
2 -
Embed
1 -
embedded
1 -
Engine
129 -
Enhancement
3 -
Enhancements
2 -
Error Message
1,984 -
Error Messages
6 -
ETS
1 -
Events
178 -
Excel
1 -
Excel dynamically merge
1 -
Excel Macro
1 -
Excel Users
1 -
Explorer
2 -
Expression
1,701 -
extract data
1 -
Feature Request
1 -
Filter
1 -
filter join
1 -
Financial Services
1 -
Foodie
2 -
Formula
2 -
formula or filter
1 -
Formula Tool
4 -
Formulas
2 -
Fun
4 -
Fuzzy Match
617 -
Fuzzy Matching
1 -
Gallery
593 -
General
93 -
General Suggestion
1 -
Generate Row and Multi-Row Formulas
1 -
Generate Rows
1 -
Getting Started
1 -
Google Analytics
140 -
grouping
1 -
Guidelines
11 -
Hello Everyone !
2 -
Help
4,134 -
How do I colour fields in a row based on a value in another column
1 -
How-To
1 -
Hub 20.4
2 -
I am new to Alteryx.
1 -
identifier
1 -
In Database
856 -
In-Database
1 -
Input
3,727 -
Input data
2 -
Inserting New Rows
1 -
Install
3 -
Installation
305 -
Interface
2 -
Interface Tools
1,651 -
Introduction
5 -
Iterative Macro
954 -
Jira connector
1 -
Join
1,743 -
knowledge base
1 -
Licenses
1 -
Licensing
210 -
List Runner
1 -
Loaders
12 -
Loaders SDK
1 -
Location Optimizer
52 -
Lookup
1 -
Machine Learning
231 -
Macro
2 -
Macros
2,508 -
Mapping
1 -
Marketo
12 -
Marketplace
4 -
matching
1 -
Merging
1 -
MongoDB
66 -
Multiple variable creation
1 -
MultiRowFormula
1 -
Need assistance
1 -
need help :How find a specific string in the all the column of excel and return that clmn
1 -
Need help on Formula Tool
1 -
network
1 -
News
1 -
None of your Business
1 -
Numeric values not appearing
1 -
ODBC
1 -
Off-Topic
14 -
Office of Finance
1 -
Oil & Gas
1 -
Optimization
650 -
Output
4,523 -
Output Data
1 -
package
1 -
Parse
2,108 -
Pattern Matching
1 -
People Person
6 -
percentiles
1 -
Power BI
197 -
practice exercises
1 -
Predictive
2 -
Predictive Analysis
824 -
Predictive Analytics
1 -
Preparation
4,649 -
Prescriptive Analytics
186 -
Publish
230 -
Publishing
2 -
Python
731 -
Qlik
36 -
quartiles
1 -
query editor
1 -
Question
18 -
Questions
1 -
R Tool
454 -
refresh issue
1 -
RegEx
2,114 -
Remove column
1 -
Reporting
2,122 -
Resource
15 -
RestAPI
1 -
Role Management
3 -
Run Command
501 -
Run Workflows
10 -
Runtime
1 -
Salesforce
245 -
Sampling
1 -
Schedule Workflows
3 -
Scheduler
372 -
Scientist
1 -
Search
3 -
Search Feedback
20 -
Server
527 -
Settings
759 -
Setup & Configuration
47 -
Sharepoint
466 -
Sharing
2 -
Sharing & Reuse
1 -
Snowflake
1 -
Spatial
1 -
Spatial Analysis
559 -
Student
9 -
Styling Issue
1 -
Subtotal
1 -
System Administration
1 -
Tableau
464 -
Tables
1 -
Technology
1 -
Text Mining
415 -
Thumbnail
1 -
Thursday Thought
10 -
Time Series
397 -
Time Series Forecasting
1 -
Tips and Tricks
3,798 -
Tool Improvement
1 -
Topic of Interest
40 -
Transformation
3,232 -
Transforming
3 -
Transpose
1 -
Truncating number from a string
1 -
Twitter
24 -
Udacity
85 -
Unique
2 -
Unsure on approach
1 -
Update
1 -
Updates
2 -
Upgrades
1 -
URL
1 -
Use Cases
1 -
User Interface
21 -
User Management
4 -
Video
2 -
VideoID
1 -
Vlookup
1 -
Weekly Challenge
1 -
Weibull Distribution Weibull.Dist
1 -
Word count
1 -
Workflow
8,505 -
Workflows
1 -
YearFrac
1 -
YouTube
1 -
YTD and QTD
1
- « Previous
- Next »