Weekly Challenges
Solve the challenge, share your solution and summit the ranks of our Community!Also available in | Français | Português | Español | 日本語
IDEAS WANTED
Want to get involved? We're always looking for ideas and content for Weekly Challenges.
SUBMIT YOUR IDEA- Community
- :
- Community
- :
- Learn
- :
- Academy
- :
- Challenges & Quests
- :
- Weekly Challenges
- :
- Re: Challenge #208: COVIZ-19
Challenge #208: COVIZ-19
- Subscribe to RSS Feed
- Mark Topic as New
- Mark Topic as Read
- Float this Topic for Current User
- Bookmark
- Subscribe
- Mute
- Printer Friendly Page
- Mark as New
- Bookmark
- Subscribe
- Mute
- Subscribe to RSS Feed
- Permalink
- Notify Moderator
A solution to last week’s challenge can be found here.
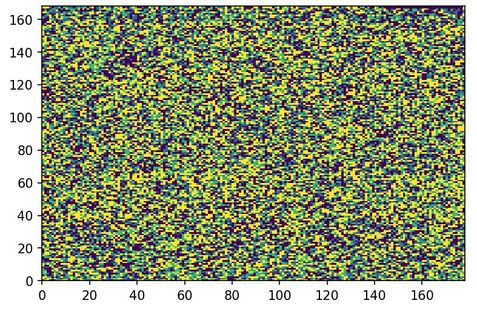
This week - let's do an interesting viz! We have sourced the RNA sequencing of SARS-CoV-2 (which is responsible for COVID-19) and would like to put it into a gridded visualization.
Since RNA is made of up the base pairs of G,T,A, and C, your visualization should have four colors. When creating the grid, try to order the sequencing from left to right: For example, the first base pairs are A-T-T-A. Make sure that A is row 1 column 1, T is row 1 column 2, and so on...
Make note of how many columns make up a row or what colors you select are entirely up to you (our solution has 178 columns)!
If you want to take it a step further, let's see if you can create something new entirely!
Data sourced from: https://www.ncbi.nlm.nih.gov/nuccore/MN908947.3
Inspired by:
https://www.reddit.com/r/dataisbeautiful/comments/fkwova/oc_rna_sequence_of_covid19_this_8kb_of_data...
- Mark as New
- Bookmark
- Subscribe
- Mute
- Subscribe to RSS Feed
- Permalink
- Notify Moderator
I went for a black and white pattern
- Mark as New
- Bookmark
- Subscribe
- Mute
- Subscribe to RSS Feed
- Permalink
- Notify Moderator
Took me a few tries to land on this solution. Glad to see that my thought process matched @patrick_digan's excellent first solution.
The .4 mile grid was found iteratively: it provides the nearest larger number of grids than we have rows in the tokenized data set.


- Mark as New
- Bookmark
- Subscribe
- Mute
- Subscribe to RSS Feed
- Permalink
- Notify Moderator
Certainly a topical weekly challenge:
- Mark as New
- Bookmark
- Subscribe
- Mute
- Subscribe to RSS Feed
- Permalink
- Notify Moderator
- Mark as New
- Bookmark
- Subscribe
- Mute
- Subscribe to RSS Feed
- Permalink
- Notify Moderator
- Mark as New
- Bookmark
- Subscribe
- Mute
- Subscribe to RSS Feed
- Permalink
- Notify Moderator
- Mark as New
- Bookmark
- Subscribe
- Mute
- Subscribe to RSS Feed
- Permalink
- Notify Moderator
Not 100% sure if I've approached this correctly but here's my video solution for it: https://www.youtube.com/watch?v=0RuHrWjVtWs&list=PL18SpOXDj-KMUD4YwWC5vZaUsIa7drxNZ&index=13&t=0s
- Mark as New
- Bookmark
- Subscribe
- Mute
- Subscribe to RSS Feed
- Permalink
- Notify Moderator
- Mark as New
- Bookmark
- Subscribe
- Mute
- Subscribe to RSS Feed
- Permalink
- Notify Moderator
My solution attached. Went a different route from most of the other solutions I've seen.

-
Advanced
302 -
Apps
27 -
Basic
158 -
Calgary
1 -
Core
157 -
Data Analysis
185 -
Data Cleansing
5 -
Data Investigation
7 -
Data Parsing
14 -
Data Preparation
238 -
Developer
36 -
Difficult
87 -
Expert
16 -
Foundation
13 -
Interface
39 -
Intermediate
268 -
Join
211 -
Macros
62 -
Parse
141 -
Predictive
20 -
Predictive Analysis
14 -
Preparation
272 -
Reporting
55 -
Reporting and Visualization
16 -
Spatial
60 -
Spatial Analysis
52 -
Time Series
1 -
Transform
227
- « Previous
- Next »


