Weekly Challenges
Solve the challenge, share your solution and summit the ranks of our Community!Also available in | Français | Português | Español | 日本語
IDEAS WANTED
Want to get involved? We're always looking for ideas and content for Weekly Challenges.
SUBMIT YOUR IDEA- Community
- :
- Community
- :
- Learn
- :
- Academy
- :
- Challenges & Quests
- :
- Weekly Challenges
- :
- Re: Challenge #18: Predicting Baseball Wins
Challenge #18: Predicting Baseball Wins
- Subscribe to RSS Feed
- Mark Topic as New
- Mark Topic as Read
- Float this Topic for Current User
- Bookmark
- Subscribe
- Mute
- Printer Friendly Page
- Mark as New
- Bookmark
- Subscribe
- Mute
- Subscribe to RSS Feed
- Permalink
- Notify Moderator
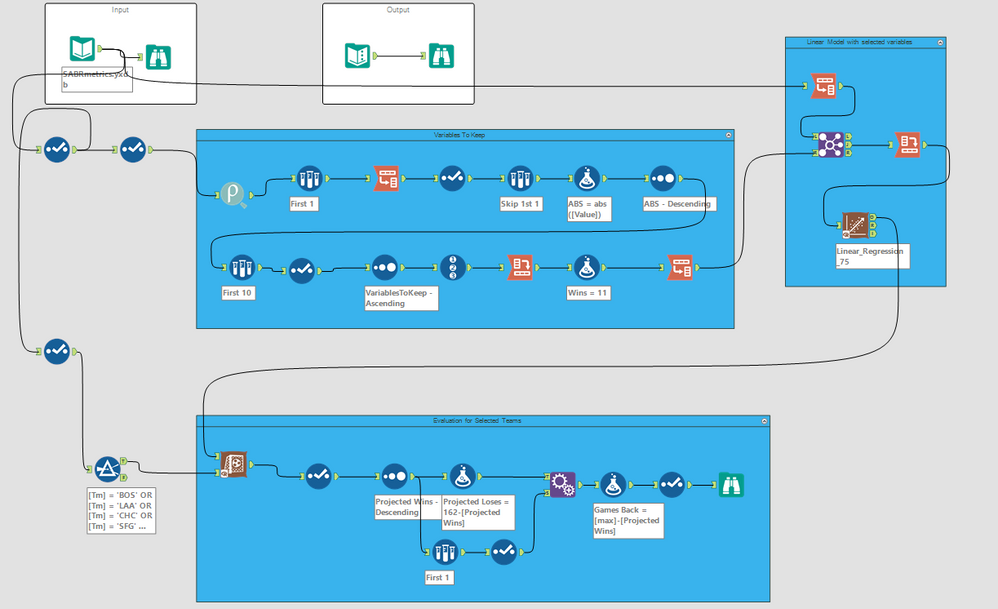
Without taking a peak at anyone's work, I selected those ten highly correlated variables and create the linear regression; if you add the Win_Pct to the variables, it basically returns the same amount of wins. In addition of the R squared and adjusted R squared values being very low, almost none of the variable have good Pr values which makes them a low confidence predictors.
But the results match what was requested.
- Mark as New
- Bookmark
- Subscribe
- Mute
- Subscribe to RSS Feed
- Permalink
- Notify Moderator
Hello there @samjohnson
I enjoyed looking at your solution; I would have liked to see the macro you mention work, but I do not have installed on my computer. I do like the fact you point out that choosing highly correlated variable may push the model not to correctly predict. It was nice seeing those PCAs in action; thanks for sharing.
- Mark as New
- Bookmark
- Subscribe
- Mute
- Subscribe to RSS Feed
- Permalink
- Notify Moderator
Thanks @JORGE4900 for the kind words.
Challenge #18 posed an interesting conundrum: the challenges have presented "solutions" that everyone works towards with the goal of reproducing them. This is a key difference between developing a software solution and predictions. Software solutions can take many paths to one goal while predictive modeling can take many paths with multiple predictive solutions, or probabilities. Development is about certainty--get me from here to there with this software--while predictive modeling is about taking many paths to a probabilistic answer, whether that's a value between 0 and 1 or a value prediction such as baseball wins.
I'd like to see Alteryx support the rise of the "citizen data scientist" and focus on more tools that emphasize the predictive modeling tools and newer functionality in the data science community such as natural language processing and deep learning, consistent support for cross-validation (today it's built into some tools and not others), fix the problems with the wonderful but flawed Model Comparison tool, add support for hierarchical (and even non-numeric) clustering and cluster validation--does this data actually support 4 clusters?--and many other areas.
As a practicing data scientist and leader of a team of 5, Alteryx can become one of the most powerful tools in our belts. It already is, but Alteryx support for the "process" of data science can make it even more powerful.
- Mark as New
- Bookmark
- Subscribe
- Mute
- Subscribe to RSS Feed
- Permalink
- Notify Moderator
That is right @samjohnson
I guess that I would also like to see more support for the "citizen data scientist" as well; on the meantime, I came across Udacity's nanodegree program on Alteryx and Tableau and registered so that I could learn more about predictive analytics. On the other hand, I do like looking at everybody's approach to solving the weekly challenges because every individual takes a different path to get to the same answer.
Talk to you soon; take care.
Best regards,
Jorge
- Mark as New
- Bookmark
- Subscribe
- Mute
- Subscribe to RSS Feed
- Permalink
- Notify Moderator
Perhaps an alternative to this correlation analysis could be a multiple regression.
A multiple regression analysis would be done with independent variables that have a correlation coefficient less than 0.7 (as multicollinearity can cause other independent variable to seem statistically insignificant from 0) to find a statistically significant result.
- Mark as New
- Bookmark
- Subscribe
- Mute
- Subscribe to RSS Feed
- Permalink
- Notify Moderator
- Mark as New
- Bookmark
- Subscribe
- Mute
- Subscribe to RSS Feed
- Permalink
- Notify Moderator
Took me some time to figure out how to bring back the 10 selected variables...still not used to transpose/crosstab

- Mark as New
- Bookmark
- Subscribe
- Mute
- Subscribe to RSS Feed
- Permalink
- Notify Moderator
- Mark as New
- Bookmark
- Subscribe
- Mute
- Subscribe to RSS Feed
- Permalink
- Notify Moderator
- Mark as New
- Bookmark
- Subscribe
- Mute
- Subscribe to RSS Feed
- Permalink
- Notify Moderator
-
Advanced
302 -
Apps
27 -
Basic
158 -
Calgary
1 -
Core
157 -
Data Analysis
185 -
Data Cleansing
5 -
Data Investigation
7 -
Data Parsing
14 -
Data Preparation
238 -
Developer
36 -
Difficult
87 -
Expert
16 -
Foundation
13 -
Interface
39 -
Intermediate
268 -
Join
211 -
Macros
62 -
Parse
141 -
Predictive
20 -
Predictive Analysis
14 -
Preparation
272 -
Reporting
55 -
Reporting and Visualization
16 -
Spatial
60 -
Spatial Analysis
52 -
Time Series
1 -
Transform
227
- « Previous
- Next »
