Weekly Challenges
Solve the challenge, share your solution and summit the ranks of our Community!Also available in | Français | Português | Español | 日本語
IDEAS WANTED
Want to get involved? We're always looking for ideas and content for Weekly Challenges.
SUBMIT YOUR IDEA- Community
- :
- Community
- :
- Learn
- :
- Academy
- :
- Challenges & Quests
- :
- Weekly Challenges
- :
- Challenge #91: Getting into the Weeds
Challenge #91: Getting into the Weeds
- Subscribe to RSS Feed
- Mark Topic as New
- Mark Topic as Read
- Float this Topic for Current User
- Bookmark
- Subscribe
- Mute
- Printer Friendly Page
- Mark as New
- Bookmark
- Subscribe
- Mute
- Subscribe to RSS Feed
- Permalink
- Notify Moderator
Whew, this one was a doozy! I got some good practice on interface tools and reporting tools!
I did a few things differently than the solution in prepping the data:
* Stacked the primary and secondary weed types (the solution uses only the primary weed)
* I wasn't sure how to summarize the data, since there were multiple records per route and weed type. I tried looking around the CDOT website, but couldn't get a detailed explanation of the fields. I summarized by route and weed two ways:
1) max coverage across the route -- OR --
2) weighted average coverage using the coverage upper bound and length of road (for example, if the total route is 10 miles,and 2 miles had 0-20% coverage and 8 miles had 20-40% coverage, then the weighted average would be (2 * 20% + 8 * 40%) / 10 = 36% weighted coverage)
Interface:
Output:
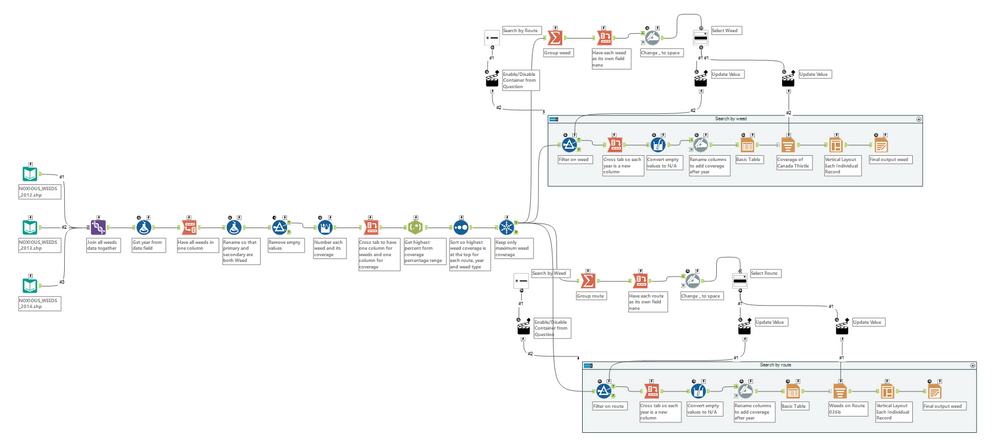
Workflow:

Inputs/interface prep

Chart output:

Table and map output:

- Mark as New
- Bookmark
- Subscribe
- Mute
- Subscribe to RSS Feed
- Permalink
- Notify Moderator
- Mark as New
- Bookmark
- Subscribe
- Mute
- Subscribe to RSS Feed
- Permalink
- Notify Moderator
- Mark as New
- Bookmark
- Subscribe
- Mute
- Subscribe to RSS Feed
- Permalink
- Notify Moderator
- Mark as New
- Bookmark
- Subscribe
- Mute
- Subscribe to RSS Feed
- Permalink
- Notify Moderator
Struggled to recreate the chart using the Interactive Chart tool so decided to produce another table instead.
- Mark as New
- Bookmark
- Subscribe
- Mute
- Subscribe to RSS Feed
- Permalink
- Notify Moderator
- Mark as New
- Bookmark
- Subscribe
- Mute
- Subscribe to RSS Feed
- Permalink
- Notify Moderator

Used the new interactive chart tool! Not super intuitive, but I managed it in the end
- Mark as New
- Bookmark
- Subscribe
- Mute
- Subscribe to RSS Feed
- Permalink
- Notify Moderator
Again a chance to practice reporting tools ... and some other, I don't use daily
- Mark as New
- Bookmark
- Subscribe
- Mute
- Subscribe to RSS Feed
- Permalink
- Notify Moderator
I spent too much time figuring out that I can't build that side-by-side bar graph in Alteryx. Unless anyone figured out how to do it, I will stick with Tableau for visualisations. At least, I tried to batch build line charts (more suitable in my opinion) and the percentages are from centered values from within the ranges.
Here's my take
- Mark as New
- Bookmark
- Subscribe
- Mute
- Subscribe to RSS Feed
- Permalink
- Notify Moderator
-
Advanced
273 -
Apps
24 -
Basic
128 -
Calgary
1 -
Core
112 -
Data Analysis
170 -
Data Cleansing
4 -
Data Investigation
7 -
Data Parsing
9 -
Data Preparation
195 -
Developer
35 -
Difficult
69 -
Expert
14 -
Foundation
13 -
Interface
39 -
Intermediate
237 -
Join
206 -
Macros
53 -
Parse
138 -
Predictive
20 -
Predictive Analysis
12 -
Preparation
271 -
Reporting
53 -
Reporting and Visualization
17 -
Spatial
59 -
Spatial Analysis
49 -
Time Series
1 -
Transform
214
- « Previous
- Next »


