Weekly Challenges
Solve the challenge, share your solution and summit the ranks of our Community!Also available in | Français | Português | Español | 日本語
IDEAS WANTED
Want to get involved? We're always looking for ideas and content for Weekly Challenges.
SUBMIT YOUR IDEA- Community
- :
- Community
- :
- Learn
- :
- Academy
- :
- Challenges & Quests
- :
- Weekly Challenges
- :
- Challenge #89: Analyzing Social Data
Challenge #89: Analyzing Social Data
- Subscribe to RSS Feed
- Mark Topic as New
- Mark Topic as Read
- Float this Topic for Current User
- Bookmark
- Subscribe
- Mute
- Printer Friendly Page
- Mark as New
- Bookmark
- Subscribe
- Mute
- Subscribe to RSS Feed
- Permalink
- Notify Moderator

- Mark as New
- Bookmark
- Subscribe
- Mute
- Subscribe to RSS Feed
- Permalink
- Notify Moderator

Read from directory rather than individual CSVs. Got top tweet based on # retweets for each file. Converted date/time.
- Mark as New
- Bookmark
- Subscribe
- Mute
- Subscribe to RSS Feed
- Permalink
- Notify Moderator
- Mark as New
- Bookmark
- Subscribe
- Mute
- Subscribe to RSS Feed
- Permalink
- Notify Moderator
- Mark as New
- Bookmark
- Subscribe
- Mute
- Subscribe to RSS Feed
- Permalink
- Notify Moderator
Went for cleaning up the data and preparing it for analysis of top 10 hashtags within the gathered data.

- Mark as New
- Bookmark
- Subscribe
- Mute
- Subscribe to RSS Feed
- Permalink
- Notify Moderator


- Mark as New
- Bookmark
- Subscribe
- Mute
- Subscribe to RSS Feed
- Permalink
- Notify Moderator
- Mark as New
- Bookmark
- Subscribe
- Mute
- Subscribe to RSS Feed
- Permalink
- Notify Moderator

- Mark as New
- Bookmark
- Subscribe
- Mute
- Subscribe to RSS Feed
- Permalink
- Notify Moderator
I finally made it!
This challenge has been sitting with me for a while, since all the other challenges has a fixed output, this one was like starring at a blank canvas.
So my workflow is rather messy, but I used Alteryx to do the preliminary data analysis, to see which data needed to be adjusted/fixed.
Then I used Tableau as my choice for visualize the data, since I am more used to Tableau, than the Alteryx reporting capabilities.
Once the data was in Tableau, I could see, that I had to go back and fix some further data (like the users do change there username and/or screen name), but I would think these kind of iterations is quite normal
 My Workflow
The Tableau result can bee seen on Tableau Public:
https://public.tableau.com/views/Challenge89AnalyzingSocialData/Dashboard1?:language=en&:display_cou...
And ended up looking like this:
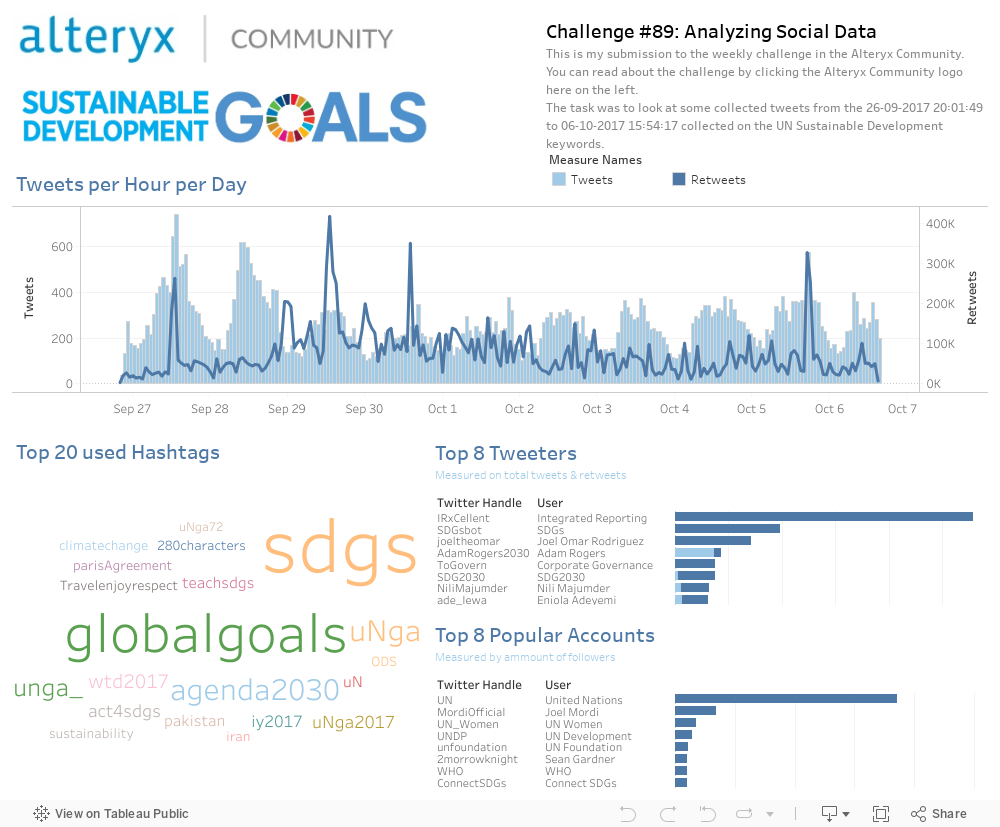
Some interesting observations, most top tweeters does not produce new tweets, but is mostly just re-tweeting, except for Adam Rogers, who in that time frame tweeted 146 times, but only re-tweeted 26 times
Still Climbing
/Verakso
- Mark as New
- Bookmark
- Subscribe
- Mute
- Subscribe to RSS Feed
- Permalink
- Notify Moderator
My solution


-
Advanced
273 -
Apps
24 -
Basic
128 -
Calgary
1 -
Core
112 -
Data Analysis
170 -
Data Cleansing
4 -
Data Investigation
7 -
Data Parsing
9 -
Data Preparation
195 -
Developer
35 -
Difficult
69 -
Expert
14 -
Foundation
13 -
Interface
39 -
Intermediate
237 -
Join
206 -
Macros
53 -
Parse
138 -
Predictive
20 -
Predictive Analysis
12 -
Preparation
271 -
Reporting
53 -
Reporting and Visualization
17 -
Spatial
59 -
Spatial Analysis
49 -
Time Series
1 -
Transform
214
- « Previous
- Next »