Engine Works
Under the hood of Alteryx: tips, tricks and how-tos.- Community
- :
- Community
- :
- Learn
- :
- Blogs
- :
- Engine Works
- :
- Exploratory Data Analysis in Alteryx
- Subscribe to RSS Feed
- Mark as New
- Mark as Read
- Bookmark
- Subscribe
- Printer Friendly Page
- Notify Moderator
When we start any data analysis process, a fundamental part that we usually ignore is the Exploratory Data Analysis (EDA). And why is it important? The data is not always (almost never) perfect, so it is necessary to verify its quality. This article will cover the various tools and methods that can be used for EDA in Alteryx.
For this article, I will be using a dataset of FIFA players in 2019, which you can review here.
Data cleaning tool
Suppose, when reviewing the data, we detect that we have null values, extra spaces at the beginning or end, and other issues that frequently happen with the data. In that case, we can easily solve them using the cleaning tool, which is found in the Preparation category.
With this, when selecting the columns that need cleaning, we can:
- Remove entire columns or rows that have only null values
- Replace null values with blanks in the case of text fields and change nulls to zeros in the case of numeric ones
- Remove leading and trailing white spaces, tabs, line breaks, and duplicate spaces
- Remove all blanks
- Remove numbers, letters, or punctuation marks
- Change the text to uppercase, lowercase, or only the first letter of each word in uppercase
This tool facilitates the most common cleaning tasks that occur in almost any data set.
Results window
It is also possible to do cleaning directly on the data in the results window.
When viewing the data, we can click on the 3 points that appear next to the field. A menu is displayed with options according to the type of data to clean, filter, or sort directly in the results.
When we select the desired treatment, we must click on Apply to see the result, which will present us with the data directly; if we also want to add the tool to our flow, we can do it by clicking on the check that appears above, if we do not want to keep the process we did, we can select the red icon to remove it.
Data health
To learn more about our data quality with a one-click report, we can use the Data Health tool found in the Machine Learning category.
It does not require configuration and allows us to see outlier data, which are outside the ranges of the majority.
These values can be problematic for our analyses, so it is important to identify them and treat them appropriately.
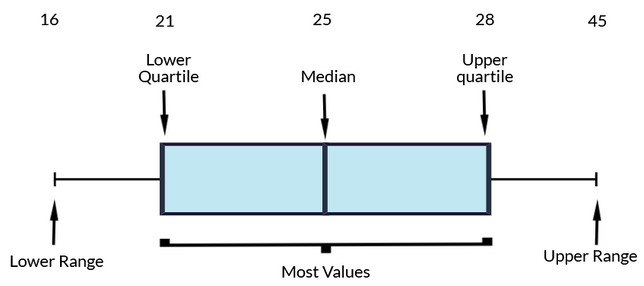
For example, in our data set, we have players who are 45 years old, but there could be some with 55 or 60--just a few, but they are out of range. This may be due to errors in data capture, an anomaly worth analyzing individually, or deviations that are better to reduce so that they do not influence the rest of our analyses.
The health report tells us that we have 17 columns with no outlier issues, one rated poor, and 25 rated very poorly.
To solve it, we can use the free CReW Modify Outliers macro that you can find in the public Gallery within the community.
You will also find it attached at the end of this article. This macro has several extremely useful and simple options.
First, we will make the selection of the fields. It is good practice to leave out the ID fields as these are not useful for our analysis.
Next, we can remove the outliers directly. It is the simplest and most recommended option depending on the type of analysis that we are going to carry out.
The last option we can take is to keep the outliers but limited. This is done with:
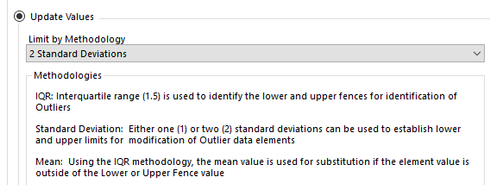
- Interquartile range (IQR), if the value is 1.5 quartiles away from the mean, it will update its value
- Standard deviation, 1 or 2 deviations to modify the limits
- Mean, to replace outliers with the mean
This is a quick and easy way to reduce the impact of outliers in downstream analyses.
Field Summary
Another great option for exploring data is to use the field summary tool, found in the Data Investigation category.
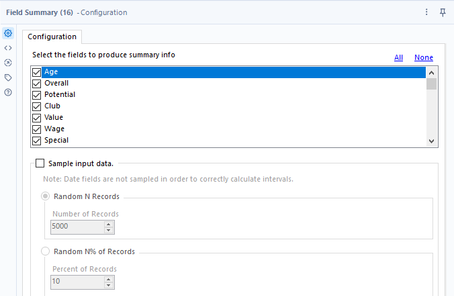
The configuration is very simple, we only select the fields that we want to explore, and that's it. In case it is a very large data set, to speed up the process, we can select a sample of the data as well.
It shows us two outputs: one with a static report and one with a dynamic one. The static report presents a scatter plot for the numerical values and central tendency statistics.
This is useful for identifying the distribution of fields and the presence of outliers on a scatterplot. The information that appears depends on the data type of the selected field. In the interactive report output, we can see histograms of all the columns, and this is interactive.
It is possible to filter the columns that we want to see and click on any graph to go to the detail.
Below, you can see the detailed statistics and a summary of the field.
This will allow us to get to know our data in greater detail, discover relationships between columns that we did not know about, and other relevant findings.
Bivariate analysis
To continue with the visualizations, we can use two variables to see their influence and the relationship between them. If we have only numerical values, we use a Scatterplot found in the Data Investigation category.
The configuration only requires selecting two numeric fields to generate the display.
The report presents us with the contrast between both variables, in this case, the Age in the X and the salary in the Y. Thus, we see the relationship between both, and we can conclude that the players who earn more are between 30-35 years old, the next highest salary level is between 25-30 years.
On the right, we can also see that we have some players older than the rest. Regarding salary, it shows us that some players earn much more than most.
This graph is very useful to understand the influence of two variables, in addition to their distribution, and will allow us to determine if we keep it for our analysis.
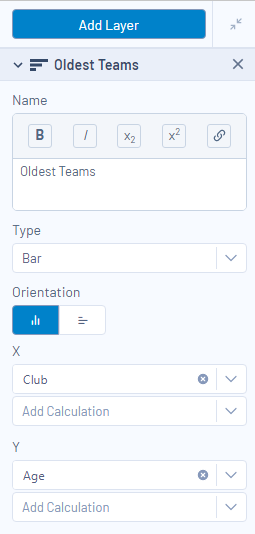
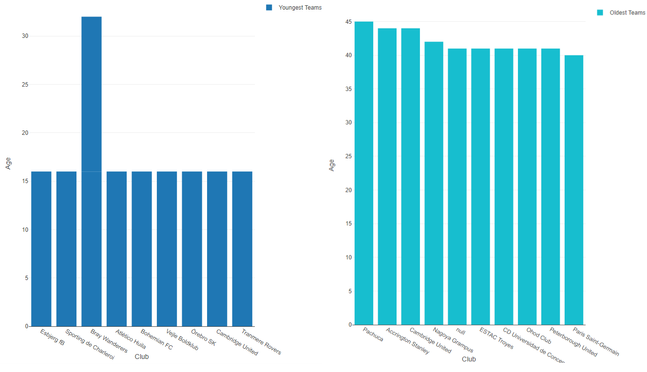
We will do the following bivariate analysis with a bar graph using the interactive graph tool of the Report Generator category. For the older teams, we sort the clubs in descending order by age, select the top 10 clubs and plot them. For the younger teams, we sort the clubs in descending order by age, select the top 10 clubs and plot them.
To select a data sample, we use the Sample tool, which is in the preparation category.
In the configuration, we add the field club and age.
Here we can see which teams have the oldest players and which have the youngest.
This will allow us to expand the knowledge of the data and how they relate and interact with each other.
Conclusion
As we saw, it is especially important that, before doing any analysis, we start exploring the data we have. We must know if the fields require cleaning, structuring, or transforming. It is important to identify possible capture errors in the processes, understand how they are, and, based on that, make decisions and obtain results from the data quickly.
In this way, the following steps of any analysis that we conduct will be simpler.
You must be a registered user to add a comment. If you've already registered, sign in. Otherwise, register and sign in.


