Engine Works
Under the hood of Alteryx: tips, tricks and how-tos.- Community
- :
- Community
- :
- Learn
- :
- Blogs
- :
- Engine Works
- :
- Step Into The Debug Macro
- Subscribe to RSS Feed
- Mark as New
- Mark as Read
- Bookmark
- Subscribe
- Printer Friendly Page
- Notify Moderator
Who?
Who needs the Debug Macro? If you're building macros in Alteryx, YOU need the Debug Macro. If you're not building macros in Alteryx, you need to build macros in Alteryx. And you need the Debug Macro.
What?
What's the Debug Macro? It's a macro that lets you take a fresh custom macro you've developed, which you're testing/running within another workflow (the 'Tester' workflow if you will), and it enables you to pop your custom macro open to see it run in Alteryx Designer, in Debug Mode, naked as the day it was dev'd, running just like it does within the Tester workflow!
In IDE terms: the Debug Macro lets you "Step Into" your macro at runtime.
When?!
AT LAST!
Where?
Right there in your toolbar, in the Developer tool category...
...after you download it from the Alteryx Gallery Macro District here and save it to a directory with a 'watched' Macro Search Path. (Under User Settings. See Alteryx Help.)
Why?
Why would you want this macro? If you've been building a lotta Alteryx macros, you already know the answer why: it's YOU. You're doing awesome stuff. And you're human. Occasionally, you screw up.
Why do I know this? I’m human. Way human. Sometimes I can really put the “um” in human. I’ve had the opportunity to work on some very advanced macro development here at Alteryx, and with great final products frequently came lost evenings along the way trying to debug them. The problem was: I couldn’t see what the problem was.
Why do you need this? Because the biggest macro-related human problems creep up not when developing them in the Designer, but when testing/running them within another workflow.
Why did I build this macro? Selfish reasons. I wanted this functionality for years, because I love creating and I want to create more; I don’t love debugging and I want to debug less.
So I finally sat down--for months when my family slept or found better things to do than watch me pace—to build the Debug Macro. This was my white whale. And now she's my baby.
How?
How does the Debug Macro work?
Fair question, no denying that, and we'll cover that further down, but for now wouldn’t you really rather talk about how you USE it? (And mind you this is in no way attempting to evade, bury, obfuscate, or delay the revelation of some dark or terrifying truth buried deep in the final section of this blog posting.)
Fine, so how do you USE the Debug Macro?
There, much happier question.
- Simple: Follow Directions.
- Conveniently, ALL directions for using the macro are found on the macro interface itself, laid out in tabs. No need for a rehash here.
- If you gloss over directions, it won’t work; if you follow all the directions, you likely won't go wrong.*
- Conveniently, ALL directions for using the macro are found on the macro interface itself, laid out in tabs. No need for a rehash here.
Nutshell it—how’s it done?
Actually there are no configurations on the Debug Macro itself.
Instead:
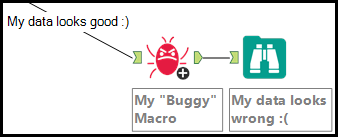
- You’ve got your Buggy Macro running in another Tester workflow, and the results look wrong.
- Make a couple 1-time tweaks to your Buggy macro and/or to the Tester workflow, where applicable.
- Insert the Debug Macro onto the Tester canvas and make a couple other clicks.
NOTE: When you insert the Debug Macro onto the canvas, it will appear to be in an errored state, but if you follow directions then it should work when you hit 'run'. - SAVE!!! And then run the Tester workflow.
- Click a link on the Results Window.
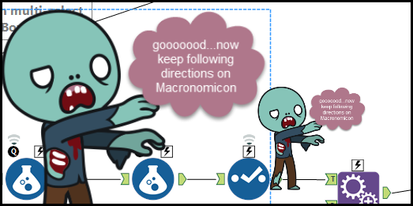
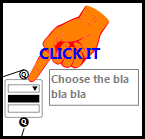
Then some magic happens: a copy of your macro opens, with little zombie’s strolling across the canvas reminding you it’s a copy of your macro and that you should keep following the directions on the Debug Macro interface. - Look for these Click Me fingers that appear on specific places on the canvas, and if present, click the tools they point at.
- And you’re there. Now simply debug your macro--via the Interface Designer--just like you would an Alteryx App.
- But BONUS BONUS BONUS!
- Your macro's underlying XML has been prepared for the 'Open Debug' button on the Interface Designer.
- Your Tester runtime data is already in place.
- And you have a .yxwv config file to instantly sync in the Tester config.
And that about wraps it up, so enjoy your macro development and have a great--
HEY YOU SAID YOU'D ANSWER HOW IT WORKS!
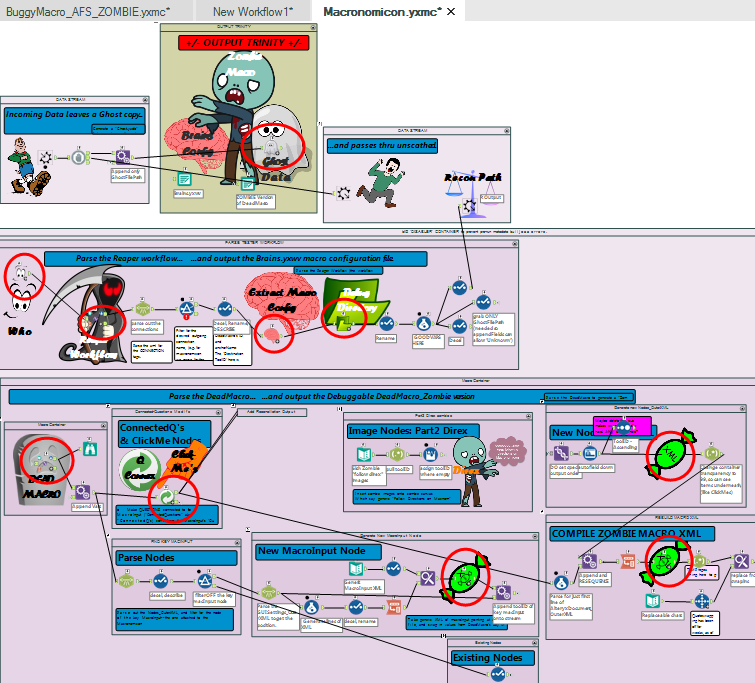
In truth the answer to this question is quite beyond the scope of a single blog entry. All told, the Debug Macro is actually a combination of a full 17 custom macros designed to achieve the Debug Macro functionality. But this structure wasn’t for fun; rather this design yields benefits, the biggest being: it contains a set of genericized reusable macros, accomplishing functions applicable to a range of Alteryx development, not just the Debug Macro. So not only can you use the Debug Macro to help you build your macros when something’s wrong, you’ll also be able to pull it apart and use the component macros to help you build your macros when everything’s right.
The component macros underlying the Debug Macro will appear in your toolbar, organized into a single developer-tool category:
- The Who
- InputWorkflow
- ExtractMacroConfiguration
- DynamicInlineOutput
- DynamicMakeDirectory
- XMLWrapper
- ClickMe
- And more…
Here’s a peek inside the Debug Macro, with component/child macros circled. Pop them open and check them out. Time permitting--and if the community folks let me back on the calendar—maybe I’ll blog about these soon!
Not good enough. How does this thing really work? Where did this thing come from?
I’d really rather not get into it, but if you must know:
The wisdom powering the Debug Macro is, in fact, the Macronomicon—the Ancient Book of the Dead Macro, whose teachings detail how to bring your Dead Macros back to life.
As any third-grader will tell you, a ghost is a soul without a body; a zombie is a body without a soul. The link to the living? Brains. Applying the teachings, the Debug Macro generates those same 3 elements:
- Your reanimated macro workflow - The Zombie Macro
- Your incoming runtime data - The Ghost Data File
- And your macro runtime configuration - The Brains Config File
These 3 elements, along with a positive attitude, will help you figure out how you killed your macro, and see it live again!
Enjoy version 1 of the Debug Macro, and BUILD MORE MACROS!!
* In present form, the Debug Macro reflects its ancient, deep, and powerful roots, and it also reflects a lack of sleep. There's more in the plans, to make it easier, with fewer steps. And like I said, I’m human, and though I tested this quite extensively, this labor of love has been a skunkworks project done on my own time, so you just might find things wrong with it. Awesome--I want to know about it--let me know right away!
Download the Debug Macro from the Alteryx Gallery Macro District here
You must be a registered user to add a comment. If you've already registered, sign in. Otherwise, register and sign in.


