Remember the first time you climbed a tree? There’s something to be said for perspective, and that’s exactly what I’ll be addressing in this blog post.
As you are already aware, R is an open-source statistical package, but it can do more than crunch numbers it’s also capable of a vibrant and diverse array of visual outputs. These outputs are easily streamed into the flexible and automated Alteryx reporting tools as snippets, just as if you were working with a Chart or a Table. In that sense, the R tool in Alteryx allows more than just the incorporation of predictive analytics, but also much of the functionality found within the Formula, Chart, Table, and Map tools.
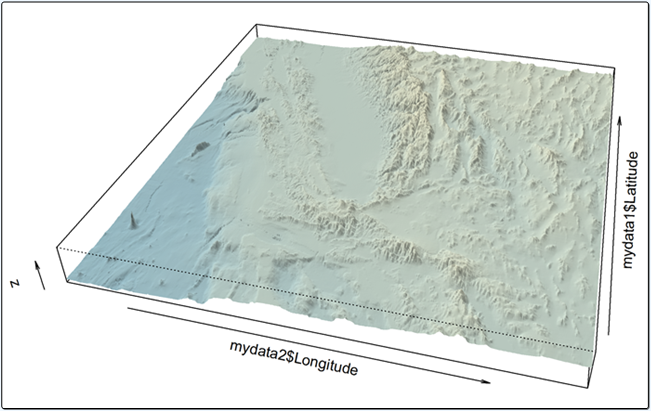
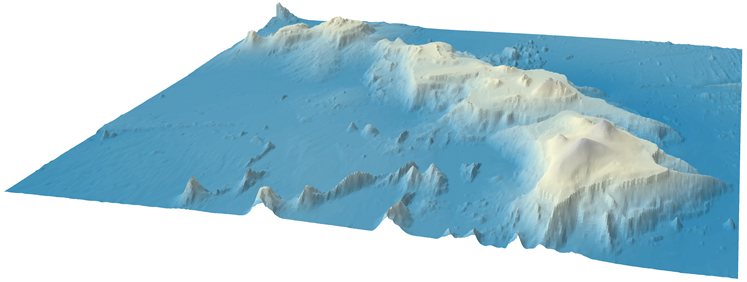
The map seen above was created using the persp() function. This function receives your x and y data in addition to your z data as a matrix of the x and y values. For more specific information about the arguments available to this function, I’ll refer you to this http://stat.ethz.ch/R-manual/R-devel/library/graphics/html/persp.html link.
Let’s take a look at the configuration of the R code inside of the R tool in Alteryx, here’s the first bit:

You will notice that we stream our x, y, and z data into Alteryx as three separate inputs; this simplifies the configuration process with our R code. Take note of the values for “nrow” and “ncol”, they coordinate with the number of records we have for our Longitude and Latitude, respectively and define the dimensions of our matrix. You will also note that these records have been sorted, first by Latitude – Ascending, then Longitude – Ascending. Persp() requires that it receive increasing values of both x and y. When the matrix is populated with our elevation data, it does so by column, working from top to bottom before moving to the next column. This technique of data storage is a requirement for working with the persp() and similar functions within R.

Let’s take a look at the arguments I’ve defined in the R code for persp().

Here we have defined our reference to the Longitude, Latitude, and z data. “d” is set to a value of 1, which is the default for exaggerating the perspective. “border” has been set to NA, which prevents each facet or plane in the image from having a border drawn about it. “col” is how we are coloring the facets on the image. “expand” allows us to vary the vertical exaggeration of the elevation data. “shade” allows us to define the strength of the shading with regard to sun positioning. While I did not specify it in this example, the location of the sun can be defined by the “ltheta” and “lphi” arguments. “theta” defines our azimuthal viewing direction, while “phi” is for the colatitude.
While often overlooked, terrain has much to do with human decisions, whether it’s a willingness to go somewhere, or the propensity for future development. A report is a composite structure of data analysis methodologies, the very purpose of which is to provide the viewer with a multitude of perspectives by which to make an educated decision.
But let’s get to the point here, it just looks awesome!
Please check out the attached module package as an example of what I’ve discussed above.