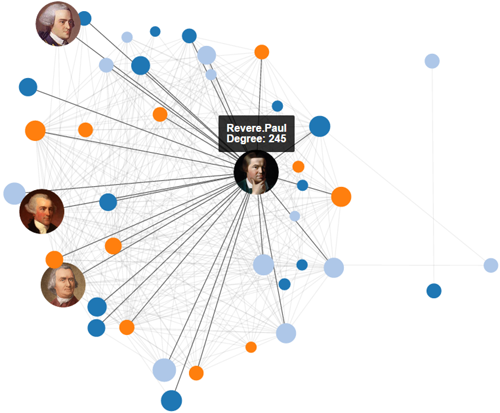
At Inspire 2015, George Mathew, our COO and President talked about how analytics could have been used against the sons and daughters of the American Revolution. In honor of the 4th of July U.S. holiday, I thought it would be interesting to elaborate on that piece and showcase some of the newest features in Alteryx.
The backstory to this is a blog post by Kieran Healy. The starting point is seemingly uninteresting metadata on the membership of a group of individuals during pre-revolutionary war times to seven different social or political organizations spread across the colonies. This metadata can be turned into a social network where two individuals are linked if they share an organization in common, and the strength of their link is proportional to the number of organizations they share in common.
The resulting network can be shown as a graph that allows one to see the central characters in play, as well as how they link the different organizations together. The network graph in Kieran's original post is static. Given more modern interactive visualization libraries like d3.js, we created a network analysis tool that can produce interactive network graphs. Click on the image below so you can explore for yourself the different characters and connections.

Network analysis has become crucial to exploring, answering and gaining insight to a wide range of business questions. For example, retailers use a technique called Market Basket analysis, where they explore patterns on what products are sold together, so that they can optimize their offerings. The results of such analysis can greatly benefit from an interactive network graph, which would allow the analyst to visually explore the relationships. Tools such as a network analysis tool will enable such interactive explorations.
Click here to see how an interactive visualization would work.
Download Now
