Analytics
News, events, thought leadership and more.- Subscribe to RSS Feed
- Mark as New
- Mark as Read
- Bookmark
- Subscribe
- Printer Friendly Page
- Notify Moderator
With the upcoming Tableau Conference 2016, November 7th ¯ 11th, we’ve enhanced the Alteryx Starter Kit for Tableau. The kit demonstrates how to bring together the powerful data blending, advanced analytics, and sharing capabilities of Alteryx, with the easy-to-understand visualizations of Tableau. Included in the kit, is an expanded set of samples with improved interfaces:
Samples |
||
|---|---|---|
| Data Blending | Predictive Analytics | Spatial Analytics |
|
|
|
The kit has been expanded, with the addition of eight new samples, including:
Customer Acquisition
An example of how a company can optimize channel-based marketing and product assortment by analyzing channel-specific data from various internal sources
Customer Response Modeling
A guided explanation of how the Logistic Regression tool can be used to answer, “How can I predict whether a customer will purchase the product I put on sale?”
Customer Segmentation
An example of how a company can optimize customer messaging through segmentation of their customer base
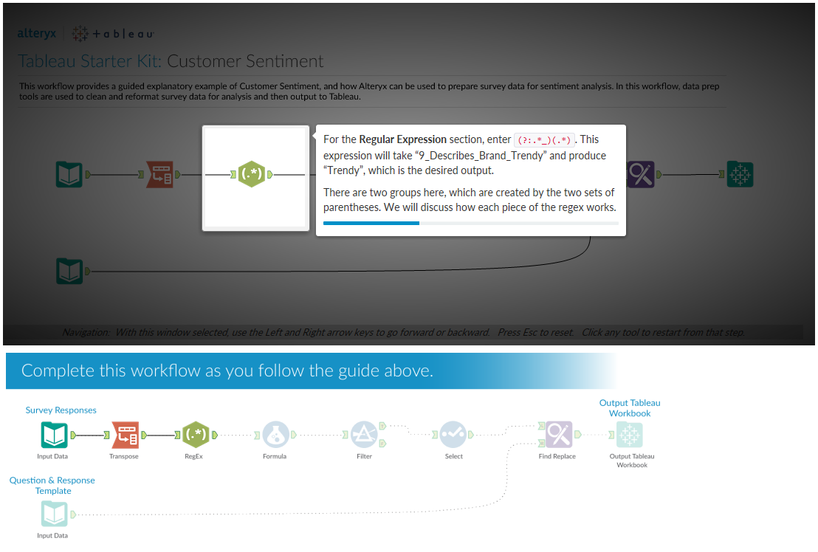
Customer Sentiment
A guided example of how Alteryx can be used to prepare survey data for sentiment analysis
Demand Forecasting
A guided explanation of how the Linear Regression tool can be used to answer, “How can I predict how much a customer will spend?”
Lifetime Value
An example of how a company can calculate Lifetime Value for their customer base
Offer Responsiveness
An example of how the A/B Testing tools can be used to examine the impact of changing the messaging of an offer for different customer segments
Vendor Fuzzy Matching
A guided example of how to combine messy data from two sources using fuzzy matching
Four of the new samples are guided. Guided samples provide an interactive step-by-step walkthrough of the workflow build process.

Three tools, found in the Tableau category of the tool palette, are also packaged with the kit: Output Tableau Workbook, Polygon for Tableau, and Publish to Tableau Server.
There are also a number of contributions from our partners:
DecisionViz
In the DevisionViz folder, you'll find Viz and Fizz. Viz and Fizz is a project born out of DecisionViz's partnerships with Alteryx and Tableau. Since we cannot share customer projects, we create portfolios to demonstrate our approach to visualization and user design, as well as the strengths of each product separately and working together.
The popularity of Viz and Fizz as a learning tool — and a beer finder — had us create the third release for the Tableau Customer Conference 2016, with previous versions for Tableau 2015 Las Vegas and Alteryx Inspire 2016 San Diego.
You can read about the project detail here https://decisionviz.com/viz-and-fizz/.
Slalom
In the Slalom folder you'll find a utility to document fields in a Tableau workbook. If you’ve ever had to document the calculations or fields used in a Tableau workbook, you know it’s a tall task. For most people it’s largely a manual process of editing the calculations and copying the formula and field name into a spreadsheet. If it’s a large workbook with many multi-level calculations or you’re just trying to keep up with documenting or auditing multiple versions through the development process, it can be overwhelming.
In this example at Tableau workbooks (.twb) and Tableau datasources (.tds) are written in XML, the alteryx app that I built can turn the metadata extraction of an entire directory of Tableau workbooks into a light exercise. The app is built to extract the fields, data types and calculation formula by worksheet and workbook and union them into a single csv file.
The Information Lab
In the Information Lab folder you'll find a workflow to extract data from your Alteryx Server Scheduler to allow for analysis of workflow execution times, completion status, error messages & more. Output the results to Tableau and visualize the results, or make other modifications for your use.
InterWorks
In the InterWorks folder you can find out more about InterWorks offerings, including PowerTools for Tableau.
Import.io is the best tool for scraping structured data off the web. Alteryx is the best tool for self-service data analysis. It doesn’t take long to realize that we should put the two together. Find the connector to bring web data into Alteryx in the InterWorks folder.
USEReady
In the USEReady folder you will find instructions on how to enter a raffle for their book, A Practitioner's Guide to Alteryx, as well as a link to download a preview version of the book.
DVW Analytics
DVW provides a connector to enable you to get data out of SAP and into Alteryx, blend it with other sources, and then output the results to Tableau. You can read more about it in the whitepaper included in this folder. You can also view the DVW website at http://www.dvwanalytics.com/
Keyrus
Keyrus has provided a demonstration of Alteryx using data from Strava. You can see examples of the visualizations that go with this workflow on Tableau Public: http://bit.ly/k3yru5
Stop by the Alteryx booth at the Tableau Conference to pick up your copy of the Alteryx Starter Kit for Tableau.
You must be a registered user to add a comment. If you've already registered, sign in. Otherwise, register and sign in.