Alteryx Designer Desktop Ideas
Share your Designer Desktop product ideas - we're listening!Submitting an Idea?
Be sure to review our Idea Submission Guidelines for more information!
Submission Guidelines- Community
- :
- Community
- :
- Participate
- :
- Ideas
- :
- Designer Desktop: New Ideas
Featured Ideas
Hello,
After used the new "Image Recognition Tool" a few days, I think you could improve it :
> by adding the dimensional constraints in front of each of the pre-trained models,
> by adding a true tool to divide the training data correctly (in order to have an equivalent number of images for each of the labels)
> at least, allow the tool to use black & white images (I wanted to test it on the MNIST, but the tool tells me that it necessarily needs RGB images) ?
Question : do you in the future allow the user to choose between CPU or GPU usage ?
In any case, thank you again for this new tool, it is certainly perfectible, but very simple to use, and I sincerely think that it will allow a greater number of people to understand the many use cases made possible thanks to image recognition.
Thank you again
Kévin VANCAPPEL (France ;-))
Thank you again.
Kévin VANCAPPEL
Currently when debug mode is entered in analytic apps and macros, the direct inputs to the app/macro when the error occurred are hardcoded into a workflow in debug mode, so that errors can be more easily detected.
However, inputs into analytic apps also create global variables which can be used in the more code-heavy aspects of Alteryx such as the Formula Tool. These are not updated in the same way which can cause workflows to break in debug mode - it would be really helpful if global variables could be updated in the same way as the inputs into tools are.
-
Category Apps
-
Enhancement
This is a hybrid idea related to both posts regarding dynamic tool configuration during runtime / without having to run an analytic app.
What I would like to propose is a new optional connection type for the interface tools that can be updated with incoming connections (having a Q letter with white background), namely Drop Down, List Box, Tree and Map tools. This could be a simple R letter in a square for example, which would be located to the left of the incoming question anchor.
Use Case
Imagine an app where there are two control containers and three interface tools (Action tools excluded from the count) outside those containers, one of them is a Text Box connected to a filter tool (via an Action tool) in the first control container with the purpose of limiting the dataset by specifying a city for example, another one is a Numeric Up Down for limiting the dataset by the average transaction amounts that are greater than the specified amount. These two interface tools are contained in a Group Box in the Interface Designer.
The third interface tool is a Drop Down tool which obtains the values (which will be Store Name for this example) from the results of the Select tool (in the second control container that is connected to the output anchor of the first control container) that is connected to an incoming filter tool which is modified by the previously mentioned interface tools. Output anchor of this Select tool is connected to the hypothetical R anchor on the top of the Drop Down tool, which is then connected to an outgoing filter tool that is connected to a series of tools which ends with a Browse tool that displays basic KPI information for the store specified from the Drop Down tool.
The main difference of the R (Refresh) anchor from the Q anchor is that it will enable the user to dynamically update the incoming values (i.e., choices for a drop down tool) without having to run the workflow. Alteryx Designer will automatically execute only the tools necessary to be able to update the values (up to a certain point of the workflow only, which may also be indicated by the boundaries of the control containers containing the target tool) for the R anchor connected applicable Interface tools specified above. This will be possible by clicking the hypothetical confirm button (same appearance with the Apply Data Manipulations button) which only appears next to the Interface tools (or the Group Boxes containing them instead) that are automatically determined by Alteryx Designer to be providing downstream data to the the tools (T anchor of the Filter tool for example) sending values to the applicable Interface tools having an incoming R anchor connection.
I saw that a similar feature recently became available with Alteryx Analytics Cloud Platform with the App Builder product, and I think that Alteryx Designer Desktop could definitely benefit both from this feature and additional App Builder features (that can be adapted to Desktop counterpart) in the upcoming releases.
-
Category Apps
-
Category Interface
-
Desktop Experience
As mentioned in detail here, I think that the addition of a "run as metadata" feature could be very helpful for making the analytic apps more dynamic in addition to enabling the dynamic configuration of the tools included in analytic apps chained together in a single workflow using control containers, therefore mostly eliminating the need to chain multiple YXWZ files together to be able to utilize the previous analytic app's output (this of course doesn't include the cases where a complex WF/App would have to be built by the previous app in chain to switch to it, but Runner helps solve this issue to a certain extent provided you don't have to provide any parameters/values to the generated WF/App).
The addition of this feature would be somewhat similar to running an app with its outputs disabled, without having to run the entire app itself, but rather only certain parts specified by the user in a limited manner. Clicking the Refresh Metadata button (which will be active only if there is at least one metadata tool in the workflow) will update the data seen in the app interface (such as Drop Down lists, List Boxes etc.), provided the user selected the up-to-date input file(s) (or the data in a database is up-to-date) where the data will be obtained from.
To explain in detail with a use case, suppose you have two flows added to separate Control Containers where the second CC uses the field info of a file used in the first CC to enable the user to select a field from a drop down list to apply a formula (such as parsing a text using RegEx) for example. After specifying the necessary branch in the first CC where the field info is obtained, the user could select these tools and then Right Click => Convert to Metadata Tool to select which tools will run when the user clicks on the Refresh Metadata button. The metadata tools could of course be specified across the entirety of the workflow (multiple Control Containers) to update the metadata for all Control Containers and therefore all tabs of a "concatenated app", where multiple apps are contained in a single workflow.
With this feature, all tools that are configured as metadata tools (excluding the tools that have no configuration) will be able to be configured as a "metadata only" tool or a "hybrid" tool, meaning a hybrid tool will be able to be configured separately for its both behaviours (being able to change all configurations for a tool without any restrictions in each mode, MetaInfo would dynamically update while refreshing metadata). Metadata only configuration of a tool could be left the same as the workflow only configuration if desired.
For example an Input File marked as a hybrid tool could be configured to read all records for its workflow tool mode and only 1 record for its metadata tool mode. This could be made possible with the addition of a new tab named Metadata Tool Configuration in addition to the already existing Configuration tab, and a MDToolConfig XML tree could be added to reflect these configurations to the XML of the tool in question, separate from the Configuration XML tree, and either one of those XML trees or both of them would be present depending on the nature of the tool chosen by the user (workflow tool, metadata tool or hybrid).
This would also mean that all the metadata tool configurations of a tool could optionally be updated using Interface tools. You could for example either update the input file to be read for both the workflow tool mode and metadata mode of an input tool at once, or specify separate input files using different interface tools. As another example, the amount of records to be read by a Sample tool could be specified by a Numeric Up/Down tool but the metadata tool configuration could be left as First 1 rows, without being able to change it from the App Interface.
Hybrid tool (note how Configuration and MDToolConfig has different RecordLimit settings):
    <Node ToolID="1">
      <GuiSettings Plugin="AlteryxBasePluginsGui.DbFileInput.DbFileInput">
        <Position x="102" y="258" />
      </GuiSettings>
      <Properties>
        <Configuration>
          <Passwords />
          <File OutputFileName="" RecordLimit="" SearchSubDirs="False" FileFormat="25">C:\Users\PC\Desktop\SampleFile.xlsx|||`Sheet1$`</File>
          <FormatSpecificOptions>
            <FirstRowData>False</FirstRowData>
            <ImportLine>1</ImportLine>
          </FormatSpecificOptions>
        </Configuration>
        <MDToolConfig>
          <Passwords />
          <File OutputFileName="" RecordLimit="1" SearchSubDirs="False" FileFormat="25">C:\Users\PC\Desktop\SampleFile.xlsx|||`Sheet1$`</File>
          <FormatSpecificOptions>
            <FirstRowData>False</FirstRowData>
            <ImportLine>1</ImportLine>
          </FormatSpecificOptions>
        </MDToolConfig>
        <Annotation DisplayMode="0">
          <Name />
          <DefaultAnnotationText>SampleFile.xlsx
Query=`Sheet1$`</DefaultAnnotationText>
          <Left value="False" />
        </Annotation>
        <Dependencies>
          <Implicit />
        </Dependencies>
        <MetaInfo connection="Output">
          <RecordInfo />
        </MetaInfo>
      </Properties>
      <EngineSettings EngineDll="AlteryxBasePluginsEngine.dll" EngineDllEntryPoint="AlteryxDbFileInput" />
    </Node>
Please also note that this idea differs from another idea I posted (link above) named Dynamic Tool Configuration Change While the Workflow is Running in that the configuration is updated while the WF/App is actually running and for example the Text to Columns tool in the second CC is dynamically changed using the output of a tool in the first CC, unlike selecting an input file and clicking Refresh Metadata from the App Interface before the workflow is run.
Attached is a screenshot and an analytic app to better demonstrate the idea.
Thanks for reading.
-
AMP Engine
-
Category Apps
-
New Request
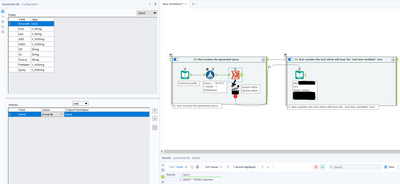
Similar to being able change the parameters of a tool using the interface tools, it could be very useful if Alteryx Designer had an option where the configuration of a tool can be modified by another tool's output (which can only consist of one row & column and may include line breaks/tab characters, only first row is used if there are multiple rows) while the workflow is running, therefore reducing the need to chain multiple apps.
This feature could be made possible as the "Control Containers" feature is now implemented, and it could work like below:
Suppose you need to write to a database and may need to specify a Pre-SQL statement or Query that needs to be dynamically changed by the result of a previous tool in the workflow.
In this case, as the configuration of a tool in the next container needs to be changed by the result of a previous formula, there would need to be an additional icon below the tools, indicating that the tool's result can be used for configuration change.
This icon which will appear below the tools will only be visible once at least one Control Container and an Action tool is added to the workflow, and will automatically be removed if all the control containers are removed from the workflow. User can change the configuration of the destination tool using an action tool, which must be connected to a tool in a container that will be run after the one it is contained in has finished running, as a tool (or several tools) that is contained in the next CC in the workflow needs to be dynamically modified before the container it is contained in is activated.
If a formula tool containing multiple formula fields is added to the action tool, the user will see all the formula outputs similar to connections (i.e. [#1], [#2]...) that can be used as a parameter.
The screenshot below demonstrates the idea, but please note that this is a change where adding an action tool may not mean that this workflow will need to become either a macro or an analytic app, so a new workflow type may or may not have to be defined, such as "Dynamic Configuration Workflow (YXDW)". Analytic Apps and Macros which utilize this feature could still be built without having to define a new workflow type.
-
Category Apps
-
Engine
-
New Request
-
UX
Perhaps a little niche but it's something I come across quite a lot so thought I'd throw this out there as a quick QoL suggestion!
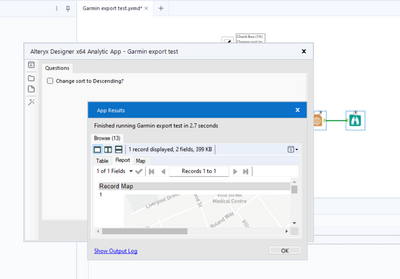
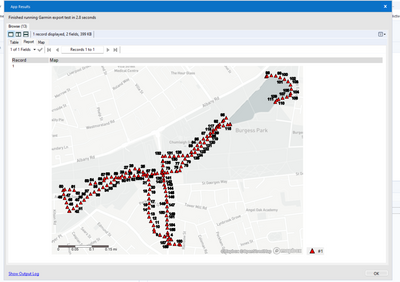
Currently when developing apps and such, we often just show results to end users via a Browse tool. However, when this output is a large table of data or a map for example, the initial results window doesn't scale out and we can often only see a tiny edge. To add to this, if we do want to resize the initial results window, we have to manually drag this as there is no maximise option like in other interfaces. Below is a quick example of what I mean.
App runs and produces this output:
The actual data/results within:
To get this second image, I have had to manually click and drag the outer edges of the Browse window, due to the lack of a maximise button. I'm aware that we can click to pop this out to a new window that does have a maximise option, but this feels like an unnecessary additional step.
So the idea here is fairly simple. Either a) increase the default size of the results window, and/or b) add a maximise button to Browse outputs.
Cheers,
Nathan
-
Category Apps
-
Desktop Experience
Improve error messages to include possible tools or solutions to help solve the error, in some cases that may be too many possibilities and it won't work but in other cases there really is only a few tools to solve some of these error messages. I'm a new user so I'm probably seeing a lot more error messages than everyone else but what would help is a list of tools or suggestions on how a user could solve some of these error messages.
-
Category Apps
-
Desktop Experience
Hi Team,
Hope you are well. I am currently tasked with downloading the contracts from SAP for my analysis.
Is it possible to develop an app or automation which can go to SAP asks for user/Pwd and download the contracts/PDFs to a specific folder?
Please let me know your thoughts,
Thanks,
Sri
-
Category Apps
-
Category Macros
-
Desktop Experience
-
User Settings
Currently : the "Label" element in the Interface Designer Layout View is a single line text input.
Why could it be impoved : the "Label" element is often used to add a block of text in an analytical application interface. And adding a block of text in a single line text input is **staying polite** quite the struggle.
Solution : make this single line text input a text box just like the formula editor.
-
Category Apps
-
Desktop Experience
To help in adding tools quickly it would be useful to have some form of quick keys or maybe somewhat a combination (enhancement) of search bar / right-click.
So here's the pic and a 1,000 words
And here's the blurb
The idea being that hitting a key whilst mouse is over the canvas would display the search bar at the mouse cursor position. Once you've selected the tool you want it hitting return[+shift] adds it to the canvas either:
- In a dragged (mouse down) state to help for final position and automated connections and then a final left-click to add to canvas or,
- Just add it at that position.
This would also speed up adding tools as you could include things like 'Recent' or 'Favorites'. I grant you that you could just incorporate this into the search dialog but save you a bit of eye movement. Don't get me wrong the search bar is great but it's the lots of drag-drop that can slow things down a bit.
-
Category Apps
-
Desktop Experience
Hello!
This is along the same lines as my other thread:
https://community.alteryx.com/t5/Alteryx-Designer-Ideas/Allow-For-Drag-and-Drop-in-The-Interface-Des...
I love building Analytic Apps, and i wish it was just a little bit quicker to do.
Currently when adding an element from the dropdown to the interface designer:
it will always be added to the bottom of the interface:
And requires moving manually. It would be great if depending on where you have selected on the interface, the element is created. For instance, i would like to select one of my elements:
Hit add - Label:
And the label be created under my element:
Thanks,
TheOC
-
Category Apps
-
Desktop Experience
Hello!
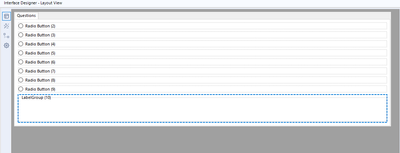
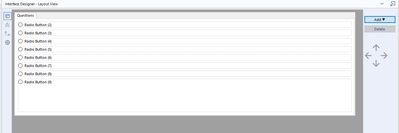
As many of you know, i'm a big fan of Alteryx Apps. However, one of the most painful parts of Alteryx Apps is moving around elements in the Interface Designer. Currently when you have many elements in your interface designer:
And add a new element from the dropdown, or through a new tool:
It is added to the bottom of the interface. Moving it to the top is currently done with the arrows, however this is very slow, especially when you have many interface elements:
Currently (with 9 radio buttons) it takes 18 clicks (each taking a couple of seconds due to delay between movements) to move it, because it moves between each step:
It would be fantastic if we could drag and drop the elements of the interface to where we like, for speed of development and ease of use.
Thanks,
TheOC
-
Category Apps
-
Desktop Experience
Hello,
Recently I've been building quite a few chained apps for specific use-cases. Some of which are typical to be run in Designer, and have many chains.
This may just be a multiple monitors pain, but when running a chained app, if I submit the first app and continue to the other if I have dragged the Analytic app window anywhere - it will reset back to its original position.
I have found this to be a pain point especially in demonstrating Analytic Apps to someone, as I tend to show one of my screens, and have to drag the new Analytic app window over at each stage. It would be a great QOL difference to have this retain its position.
Basic example for demonstration (showing both monitors):
Step 1: Run the first chained analytic app (See attached)
Step 2: Drag the app interface over, fill out the app, hit continue:
Step 3: Notice that the app interface has reset back to the right monitor:
This does seem to always start on the PC 'primary monitor', however, I don't tend to use my Alteryx on my primary monitor, and have requirements for my other monitor being the primary. I am hoping as a QOL change, it can either be changed to remember where it is (ideally) or if easier to implement, open on the monitor that has Alteryx Designer open.
Please see attached the workflow I used for an example, let me know if you have any questions.
Cheers,
TheOC
-
Category Apps
-
Desktop Experience
Dear Community,
could you please change the path processing of the alteryx app interface so that we can paste path links with quotation marks without getting an error by the alteryx app?
this would enhance workflow speed because one cannot save folder location for the interface to search for first when browsing files. it always begins at the pc level or something.
so the workaround would be to just paste the file location path in the browser window of the interface, then pressing browse again to just scroll through the wished folder.
this idea is not only for the purpose of the workaround but also for itself worth it.
in windows one can easily copy file paths by holding down shift and right mouse click and the clicking on "copy path" . the copy is in the clipboard which i would like to pass to the alteryx app just like this without the necessity to remove the quotation marks as this costs time and is difficult when paths are long.
thank you
-
Category Apps
-
Desktop Experience
-
Enhancement
Our company often builds applications where we need the ability for it to dynamically update dropdowns based on a user's previous selections.
For example:
- A user needs to select their Server, database, and table for analysis (3 dropdowns).
- When the user selects their server, a query is run to get a list of all databases on that server. Then the database dropdown will automatically populate with this list of databases.
- The user then makes a database selection, and a query is then run to get all tables within that database. The table dropdown will automatically populate with this list of tables.
- The user makes their table selection, and then runs their analysis using the server, database, and table variables with values that they have selected from each dropdown.
We can do this in other programs, but unfortunately the lack of dynamic selections/dependent dropdowns is a big limitation for us when building Alteryx applications. Our current workarounds are chaining applications together, or using PyQt within the workflow. Chaining is clunky and often causes unforeseen issues when uploading to Server with errors that are non-descriptive, and using PyQt comes with Python versioning issues.
If this interactivity can somehow be added to Alteryx applications it would be a huge upgrade to our current Alteryx processes. Any suggestions for further workarounds would also be helpful!
Thank you,
Amanda
-
Category Apps
-
Desktop Experience
-
Enhancement
I'd like to see the size of the data processing through each tool, in say GB. This would be helpful in understanding the volume of data being written to connected systems and would also be useful when cleansing data to determine if a meaningful impact was made to the data cleanliness.
-
Category Apps
-
Desktop Experience
I know that many Alteryx users have been looking for a way to output results from the Alteryx Gallery to either specified cells in an Excel workbook, or a "raw data" worksheet.
So here are a few options that don't always work:
1. Use a Run Command to duplicate an Excel template - WRONG - Unrestricted Alteryx workflows is rare.
2. Access a template in shared folder - organization's aren't all perfect, yet
Therefore, I'd like to suggest to be able to save specific files in a folder that can be included in the Alteryx package uploaded to the Gallery that the workflow can reference just to output towards.
Thoughts? I do love the Reporting tools, so this isn't a necessity - but it would help the process of delivering Alteryx output to legacy Excel users / reviewers / managers /etc.
-
Category Apps
-
Desktop Experience
I'm not exactly sure where this would fall under, so, I just chose "Alteryx Apps". While Alteryx is widely becoming popular, and there is also an increasing need to convert R code to Alteryx. The idea is having an application or an add-on to convert R code when importing into the Alteryx environment. Or just the majority of it would help a lot.
-
Category Apps
-
Desktop Experience
Hi
I want to make a suggestion for the Debug Log information shown when running an Alteryx App in Debug mode to be saved as an output when just purely running an Alteryx App. I believe this would help a great deal for audit purposes to be able to read the log again to see what did the user select for the interface tools.
Please see an example below of what I am suggesting as an output for the logging of Alteryx App:
<Value name="Contract Identifier Field - User">PolicyCode</Value>
<Value name="Contract Start Date Field - User">PolicyCreateDate</Value>
<Value name="Contract End Date Field - User">EndDate</Value>
<Value name="Model Code Field - User">ShortModel</Value>
<Value name="Full Model Code Field - User">ModelName</Value>
<Value name="Term/Monthly Field - User">PolicyType</Value>
<Value name="Contract Duration Field - User">ContractDuration</Value>
<Value name="Use Calculated Duration - User CheckBox">True</Value>
<Value name="Fuel Type Field - User">ModelName</Value>
<Value name="Underwriter Code Field - User"/>
<Value name="Commission Type Field - User"/>
<Value name="Mileage Limit Field - User"/>
<Value name="Premium Amount Field - User">PremiumExclAmount</Value>
<Value name="Current Remaining Fund Field - User">Fund</Value>
This would really help with audit purposes as once an Alteryx app is run, one can not see what was the responses to the interface questions did the user select, making it difficult if another user wanted to replicate the Alteryx App run
-
Category Apps
-
Desktop Experience
I've been spending some time looking at low-code app development platforms, and one of the features that these have which it would be great to see added into Alteryx Analytic Apps is the ability to display results directly in the app interface pane.
At the moment when an app successfully runs the results can be shown in a pop-out window, as shown below:
An example from a low code built app is this:
Therefore the new feature it would be great to add is a browse result window within the interface tool, or a way to render the results and display that in the window.
Looking forward to hearing from others and what else have you seen with web apps that it would be great to improve Alteryx Analytic Apps with?
-
Category Apps
-
Desktop Experience
- New Idea 208
- Accepting Votes 1,837
- Comments Requested 25
- Under Review 150
- Accepted 55
- Ongoing 7
- Coming Soon 8
- Implemented 473
- Not Planned 123
- Revisit 68
- Partner Dependent 4
- Inactive 674
-
Admin Settings
19 -
AMP Engine
27 -
API
11 -
API SDK
217 -
Category Address
13 -
Category Apps
111 -
Category Behavior Analysis
5 -
Category Calgary
21 -
Category Connectors
239 -
Category Data Investigation
75 -
Category Demographic Analysis
2 -
Category Developer
206 -
Category Documentation
77 -
Category In Database
212 -
Category Input Output
632 -
Category Interface
236 -
Category Join
101 -
Category Machine Learning
3 -
Category Macros
153 -
Category Parse
75 -
Category Predictive
76 -
Category Preparation
384 -
Category Prescriptive
1 -
Category Reporting
198 -
Category Spatial
80 -
Category Text Mining
23 -
Category Time Series
22 -
Category Transform
87 -
Configuration
1 -
Data Connectors
948 -
Desktop Experience
1,493 -
Documentation
64 -
Engine
122 -
Enhancement
275 -
Feature Request
212 -
General
307 -
General Suggestion
4 -
Insights Dataset
2 -
Installation
24 -
Licenses and Activation
15 -
Licensing
10 -
Localization
8 -
Location Intelligence
79 -
Machine Learning
13 -
New Request
177 -
New Tool
32 -
Permissions
1 -
Runtime
28 -
Scheduler
21 -
SDK
10 -
Setup & Configuration
58 -
Tool Improvement
210 -
User Experience Design
165 -
User Settings
73 -
UX
220 -
XML
7
- « Previous
- Next »
- vijayguru on: YXDB SQL Tool to fetch the required data
- Fabrice_P on: Hide/Unhide password button
- cjaneczko on: Adjustable Delay for Control Containers
-
Watermark on: Dynamic Input: Check box to include a field with D...
- aatalai on: cross tab special characters
- KamenRider on: Expand Character Limit of Email Fields to >254
- TimN on: When activate license key, display more informatio...
- simonaubert_bd on: Supporting QVDs
- simonaubert_bd on: In database : documentation for SQL field types ve...
- guth05 on: Search for Tool ID within a workflow
