Alteryx Designer Desktop Knowledge Base
Definitive answers from Designer Desktop experts.- Community
- :
- Community
- :
- Support
- :
- Knowledge
- :
- Designer Desktop
- :
- Linear Regression | Alteryx 11.0
Linear Regression | Alteryx 11.0
- Subscribe to RSS Feed
- Mark as New
- Mark as Read
- Bookmark
- Subscribe
- Printer Friendly Page
- Notify Moderator
on
02-15-2017
11:35 AM
- edited on
03-08-2019
12:15 PM
by
Community_Admin
PRODUCT: Alteryx Designer or Alteryx Server
VERSION: 11.0
LAST UPDATE: 02/13/2017
ATTACHMENT: None
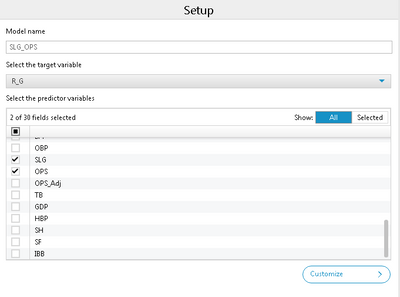
With the release of 11.0, we see numerous changes to many tools in the Designer. The Linear Regression Tool gets a UI makeover and some cool new features are added that we will explore in this article. If you are new to performing regression analysis in Alteryx, I highly recommend checking out the Tool Mastery article which goes into everything there is to the old tool. Everything presented in that article remains valid as no features were removed. In this article, we will delve into the changes and new features:
New Interface Old Interface
On the first page, you can see that most of the changes here are aesthetic. The two check boxes for model constant and weighted variable are moved to the second page when you go click “Customize”.
In the Customize menu there are three tabs. Model, Cross-validation, and Plots.
In Model, you have the two check boxes from before for model constant and weighted variable. We also have a new option for performing regularized regression.
Here we can enter or scroll to our desired alpha value, choose whether or not we want to standardize our predictor variables and cross-validate the regularized regression. We can also cross-validate a non-regularized model by enabling cross-validation in the “Cross-validation” tab.
The Plots tab is the same as the “Graphics Options” tab from the old version except if you enable regularized expression, you will get the option to “Display Graphs” which show four graphs in the R output if enabled.
Speaking of the outputs, there is still an O and an R output but now there is an I output. There are no changes in the model object (O output). If you are not performing regularized expression, there is no change here either. If you are doing regularized expression, you will get a table of the model coefficients. If “Display graphs” was checked you will get four graphs that will tell you more about the regularized model: Mean-Squared Error vs log of lambda, absolute value of individual coefficients vs fraction of deviance explained, Absolute value of individual coefficients vs L1 norm of all coefficients and Absolute value of individual coefficients vs log of lambda.
The I output is where things get very interesting. From this output, you get an interactive dashboard of the results presented in the R output. In the “Summary” tab, are some stats as well as a cool table of your coefficients that you can customize to display more information.
The model performance tab gives you some more insight on the residuals and standard error. A scatter plot of predicted vs actual values is plotted. Below you get some error values as well as a histogram for the residual values.
On the “Diagnostics” tab you get four graphs describing the residuals: Residuals vs. Fitted Values, Root-Residuals vs Fitted Values, QQ Plot and Residuals vs. Leverage.
- Mark as Read
- Mark as New
- Bookmark
- Permalink
- Notify Moderator
Is there any way to show P's & t's values on the reports, when you use Model Customization and/or Cross Validation?
-
2018.3
17 -
2018.4
13 -
2019.1
18 -
2019.2
7 -
2019.3
9 -
2019.4
13 -
2020.1
22 -
2020.2
30 -
2020.3
29 -
2020.4
35 -
2021.2
52 -
2021.3
25 -
2021.4
38 -
2022.1
33 -
Alteryx Designer
9 -
Alteryx Gallery
1 -
Alteryx Server
3 -
API
29 -
Apps
40 -
AWS
11 -
Computer Vision
6 -
Configuration
108 -
Connector
136 -
Connectors
1 -
Data Investigation
14 -
Database Connection
196 -
Date Time
30 -
Designer
204 -
Desktop Automation
22 -
Developer
72 -
Documentation
27 -
Dynamic Processing
31 -
Dynamics CRM
5 -
Error
267 -
Excel
52 -
Expression
40 -
FIPS Designer
1 -
FIPS Licensing
1 -
FIPS Supportability
1 -
FTP
4 -
Fuzzy Match
6 -
Gallery Data Connections
5 -
Google
20 -
In-DB
71 -
Input
185 -
Installation
55 -
Interface
25 -
Join
25 -
Licensing
22 -
Logs
4 -
Machine Learning
4 -
Macros
93 -
Oracle
38 -
Output
110 -
Parse
23 -
Power BI
16 -
Predictive
63 -
Preparation
59 -
Prescriptive
6 -
Python
68 -
R
39 -
RegEx
14 -
Reporting
53 -
Run Command
24 -
Salesforce
25 -
Setup & Installation
1 -
Sharepoint
17 -
Spatial
53 -
SQL
48 -
Tableau
25 -
Text Mining
2 -
Tips + Tricks
94 -
Transformation
15 -
Troubleshooting
3 -
Visualytics
1
- « Previous
- Next »


