Alteryx Designer Desktop Ideas
Share your Designer Desktop product ideas - we're listening!Submitting an Idea?
Be sure to review our Idea Submission Guidelines for more information!
Submission Guidelines- Community
- :
- Community
- :
- Participate
- :
- Ideas
- :
- Designer Desktop
Featured Ideas
Hello,
After used the new "Image Recognition Tool" a few days, I think you could improve it :
> by adding the dimensional constraints in front of each of the pre-trained models,
> by adding a true tool to divide the training data correctly (in order to have an equivalent number of images for each of the labels)
> at least, allow the tool to use black & white images (I wanted to test it on the MNIST, but the tool tells me that it necessarily needs RGB images) ?
Question : do you in the future allow the user to choose between CPU or GPU usage ?
In any case, thank you again for this new tool, it is certainly perfectible, but very simple to use, and I sincerely think that it will allow a greater number of people to understand the many use cases made possible thanks to image recognition.
Thank you again
Kévin VANCAPPEL (France ;-))
Thank you again.
Kévin VANCAPPEL
One of the tools that I use the most is the SELECT tool because I normally get large data sets with fields that I won't be using for a specific analysis or with fields that need re-naming. In the same way, sometimes Alteryx will mark a field in a different type than the one I need (e.g. date field as string). That's when the SELECT comes in handy.
However, often times when dealing with multiple sources and having many SELECT tools on your canvas can make the workflow look a little "crowded". Not to mention adding extra tools that will need later explanation when presenting/sharing your canvas with others. That is why my suggestion is to give the CONNECTION tool "more power" by offering some of the functionality found in the SELECT tool.

For instance, if one of the most used features of the SELECT tool is to choose the fields that will move through the workflow, then may be we can make that feature available in the CONNECTION tool. Similarly, if one of the most used features (by Alteryx users) is to re-name fields or change the field type, then may be we can make that available in the CONNECTION tool as well.

At the end, developers can benefit from speeding up workflow development processes and end-users will benefit by having cleaner workflows presented to them, which always help to get the message across.
What do you guys think? Any of you feel the same? Leave your comments below.
Before Designer 2019.4 there was a "bug" in the workflow statistics collection that under the "SampleModule" data from the UsageGallery collection the name of the workflow run from within Designer was available. We used that information to determine the common workflows run in our community as well as generating a measure of community growth. The "bug" was removed in 2019.4 and now we can only determine the number of runs, but not the number of distinct workflows that were run. This idea to do return the workflow name run to the information stored in the Mongo database.

I think it would be extremely useful to have a switch connector available in Alteryx. What I mean by a switch connector is a connecting line with an on/off state that will block the data stream through it when off. Something like below:
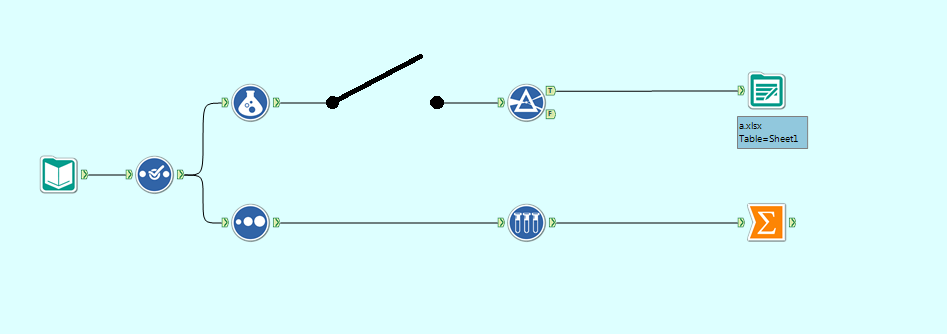
Switch Connector in an "Off" state
This would be extremely useful when you only want data to flow down some of the paths. In the example above, I might turn the switch connector to off because I want to see the Summarize results without outputting to a document.
The current methods for having a path/set of tools present but unused are insufficient for my needs. The two methods I and Alteryx support were able to find were:
2. Putting the tools in a disabled tool container - I cannot see the tools when the container is disabled. I want to be able to see my tool set-up even when I am not using it.
This is inspired by the use of switches in electrical circuit design, such as:

Please comment if you also think this would be useful, or if you have ideas for ways to improve it further. Thank you!
Its definately not a good UX that the full browse is now in the output window. I usually have my Output on autohide and its a few extra clicks to see the browses now... Can we have both the Browse Everywhere tab in Output and Configuration Panel?
A question has been coming up from several users at my workplace about allowing a column description to display in the Visual Query Builder instead of or along with the column name.
The column names in our database are based on an older naming convention, and sometimes the names aren't that easy to understand. We do see that (if a column does have a column description in metadata) it shows when hovering over the particular column; however, the consensus is that we'd like to reverse this and have the column description displayed with the column name shown on hover.
It would be a huge increase to efficiency and workflow development if this could be implemented.
I have often thought it would be nice to have a 'predicted run time' for a module calculated.
An adequate prediction might be the complete run time last time the module ran. Then, in combination with a counter of how long a module has been running so far, we’d be well armed to estimate whether to go get a cup of coffee or not.
At TargetSmart, we create a lot of CSV deliverables for our customers. Since Alteryx differentiates between blank strings and null values (a good thing), the CSV output is not consistent between the two without an explicit multi-field formula step to set all null to empty strings (or vice versa). This is an easy fix for us. However, in some cases we have very large files with thousands of fields and millions of records. For these instances, the workflow run-time is greatly increased by the multi-field formula. If possible, I was wondering if adding a checkbox option to CSV output steps (“Make null/empty consistent” or “Never quote empty/null values”) would possibly be a more efficient approach as the check could be part of the output step (which I assume is native C++) versus the Multi-field formula (which I assume has some level of inefficiency in interpreting the formula dynamically).
I recently cam across a limitation in Alteryx, where we can't download non-CSV files using Amazon S3 download tool. There is currently support only for CSV, and couple of other formats but we are using JSON files (.jl) extensively and not having the tool download the files into the workflow is disapointing as now i have to build a custom code outside Alteryx to do that before I can start my workflow.
Can this be please given prompt attention and prioritized accordingly.
It would be good to be able to fix pie chart colours (either automatically of manually), so that when building a report, categories are given the same colour throughout the report across multiple pie charts. Currently, if the number of categories being shown varies, there is no way to manually align the colours (In the Bar Chart type there is a Style Mode for the Series where you can use a formula to assign a colour based on a criteria such as the name, but not for pie charts).
I'm sure no one want's to do double dipping on huge data sets even if it's in-db...
So can we have,left and right joins in the in-db join tool as well to further develop workflows from these two additional outputs?
Ps: the idea originally belongs to another Alteryx client mentioned this in IT central; https://www.itcentralstation.com/product_reviews/alteryx-review-38876-by-prometheus-tito-amoguis-ii

Best
Alteryx needs to package SAP, JD Edwards and ADNIS and BPCS connectors as part of it's native offering. This will increase the value proposition of Alteryx designer from just data blending to full self service ETL. Most of the large organizations have data extraction challenges and will experience business user empowerment and big productivity gains if native connectors and data extraction across major ERPs is enabled. Some of these productivity gains can in turn be used to make a business case for Alteryx designer licenses.
Problem: The visual nature of Alteryx is one of its key selling points. The idea is to make work flows understandable. But when you're building something complicated, the lines cease being a helpful visualization and become a confusing mess instead. Lines cross each other. Lines cross out annotations. I know that there's wireless connections, but using too many of those makes the data flow hard to trace. So I spend time moving tools and boxes around, trying to get lines to cooperate, instead of chasing that thrill of solving.
Solution: Users should be able to click the line and place an anchor which affects the line just like a tool would, but without doing anything to the data. It would just be a little point, not a full tool. That way I could make the lines dodge my annotations without placing needless select tools or moving everything around. It could be located in the Documentation tab.
Thanks for reading,
BG
When users execute a sql statement via an input tool, the tool should be smart enough to invoke the (nolock) hint to avoid any database locking when querying a SQL database. Most users aren't advanced enough to understand how to do this in the SQL statement. It should be done automatically or at the very least, a check box option for user.
It would be nice to have the annotations that a user gives a tool with a different background color on the canvas than those tools where the annotation is being automatically populated. Example would be the user gives a tool a specific name that shows up in blue but the formula tools that display the formula preview under the tool show up in yellow.
Greenplum / Postgresql Bulk Loader Capability much like the oracle and MS Sql.
Thanks!
John
Unlike In-Memory Filter tool, the IN-DB Filter Tool does not process the NULL unless by default specified.
This results in the loss of data without warning.
I suggest you either fix it to match the in-memory filter, or display a warning somewhere, this creates many data quality issues...


This happens even if you do not reconfigure any upstream tools, but mearely access them, physically move them, say, an inch to the left or something like that, etc. Basically if you just "touch" any tool upstream, the Union Tool thinks that the manual config needs to be done over. But even if you do reconfig the Union Tool (either delete it and bring a new one in, or change the current one to Auto and then back to manual), it STILL does not recognize the tool as being correct.
The only way I have found to correct this issue is to click Play, and let it throw the error. Add Select Tools before the Union Tool to change the names to be common, then click on the Union Tool, and switch it to auto. Then click Play again. This can be very inconvenient if you have a module that takes hours (although you can limit your input records).
My suggestion would be to either disable the manual configuration, or add notes to the Help Files stating to use the manual configuration at your own risk, because once it's set and works at the time of creation, you cannot modify any upstream tools thereafter or else it will break the Union Tool and it cannot be repaired -- only choice is to use the Select Tool as I described above
Could you please assess the idea of reverse engineering existing SQL code (in special inside DataWarehouse's code, thousands of LOCs filled with SELECT and JOINS) and replace it with Alteryx widgets?
Doing this will accelerate penetration rate of Alteryx products in large companies and dismantle IBM Cognos and their cousins.
There's a common need to perform the same function on many fields, where you want to bring in data from a secondary field which is defined by the current column name.
So - for example:
Input:
- Prod1UnitWeight: 10
- Prod1Qty: 10
- Prod2UnitWeight:15
- Prod2Qty: 1
Output
- Prod1TotalWeight: 100
- Prod2TotalWeight: 15
So it would be useful to be able to have an indirect function where you can create a string which contains the field you want to use; and then indirect to it.
For example:
- Multi-field formula on Prod1Qty; and ProdQty
- CreateNewField Prod1TotalWeight
- [_CurrentField_] + indirect(replace([_currentFieldName_],"Qty","UnitWeight")
- which would resolve to prod1Qty * indirect("Prod1UnitWeight")

- New Idea 206
- Accepting Votes 1,838
- Comments Requested 25
- Under Review 149
- Accepted 55
- Ongoing 7
- Coming Soon 8
- Implemented 473
- Not Planned 123
- Revisit 68
- Partner Dependent 4
- Inactive 674
-
Admin Settings
19 -
AMP Engine
27 -
API
11 -
API SDK
217 -
Category Address
13 -
Category Apps
111 -
Category Behavior Analysis
5 -
Category Calgary
21 -
Category Connectors
239 -
Category Data Investigation
75 -
Category Demographic Analysis
2 -
Category Developer
206 -
Category Documentation
77 -
Category In Database
212 -
Category Input Output
631 -
Category Interface
236 -
Category Join
101 -
Category Machine Learning
3 -
Category Macros
153 -
Category Parse
74 -
Category Predictive
76 -
Category Preparation
384 -
Category Prescriptive
1 -
Category Reporting
198 -
Category Spatial
80 -
Category Text Mining
23 -
Category Time Series
22 -
Category Transform
87 -
Configuration
1 -
Data Connectors
948 -
Desktop Experience
1,492 -
Documentation
64 -
Engine
121 -
Enhancement
274 -
Feature Request
212 -
General
307 -
General Suggestion
4 -
Insights Dataset
2 -
Installation
24 -
Licenses and Activation
15 -
Licensing
10 -
Localization
8 -
Location Intelligence
79 -
Machine Learning
13 -
New Request
176 -
New Tool
32 -
Permissions
1 -
Runtime
28 -
Scheduler
21 -
SDK
10 -
Setup & Configuration
58 -
Tool Improvement
210 -
User Experience Design
165 -
User Settings
73 -
UX
220 -
XML
7
- « Previous
- Next »
- vijayguru on: YXDB SQL Tool to fetch the required data
- Fabrice_P on: Hide/Unhide password button
- cjaneczko on: Adjustable Delay for Control Containers
-
 Watermark
on:
Dynamic Input: Check box to include a field with D...
Watermark
on:
Dynamic Input: Check box to include a field with D...
- aatalai on: cross tab special characters
- KamenRider on: Expand Character Limit of Email Fields to >254
- TimN on: When activate license key, display more informatio...
- simonaubert_bd on: Supporting QVDs
- simonaubert_bd on: In database : documentation for SQL field types ve...
- guth05 on: Search for Tool ID within a workflow
| User | Likes Count |
|---|---|
| 40 | |
| 32 | |
| 21 | |
| 10 | |
| 7 |