Alteryx Designer Desktop Ideas
Share your Designer Desktop product ideas - we're listening!Submitting an Idea?
Be sure to review our Idea Submission Guidelines for more information!
Submission Guidelines- Community
- :
- Community
- :
- Participate
- :
- Ideas
- :
- Designer Desktop
Featured Ideas
Hello,
After used the new "Image Recognition Tool" a few days, I think you could improve it :
> by adding the dimensional constraints in front of each of the pre-trained models,
> by adding a true tool to divide the training data correctly (in order to have an equivalent number of images for each of the labels)
> at least, allow the tool to use black & white images (I wanted to test it on the MNIST, but the tool tells me that it necessarily needs RGB images) ?
Question : do you in the future allow the user to choose between CPU or GPU usage ?
In any case, thank you again for this new tool, it is certainly perfectible, but very simple to use, and I sincerely think that it will allow a greater number of people to understand the many use cases made possible thanks to image recognition.
Thank you again
Kévin VANCAPPEL (France ;-))
Thank you again.
Kévin VANCAPPEL
Do you often present your workflows to others within Alteryx, as opposed to just printing a PDF? Wouldn't be nice to have a formatted heading that describes your workflow?
I'm sure you may already be adding and formatting nice headers, like many of our Alteryx tools. For example, the Filter tool:

However, once you begin to scroll down the headers disappear. I recommend we add the ability to freeze the canvas. In this scenario, I would want to view this Header no matter how far I scroll down or right. This would be extremely beneficial when presenting to stakeholders. Additionally, it would be nice to have this repeat on each page, when printed!
Thanks,
Mark
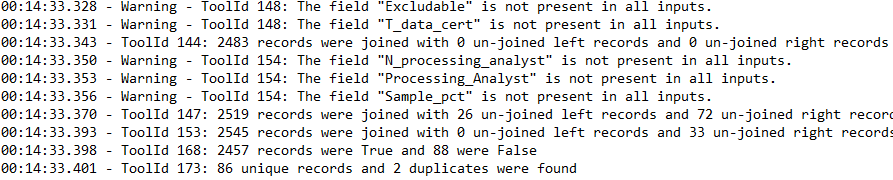
There are three places that provides the log information:
1) Regular results window:
Pro: In the process sequence so the user can understand the order of the process.
Con: Doesn't have info on how long each tool takes to process.
2) Workflow -> Runtime -> Enable Performance Profiling
Pro: Processes are sorted in the processing duration descending order which helps to identify the ones that took long to run.
Con: Doesn't show the process sequence.
3) Actual Alteryx log file:
Pro: There are timestamps for each process so the duration can be calculated.
Con: Not ready accessible and not user friendly to be seen from the interface. Not clickable to see more details in the workflow.
I think it will be SUPER HELPFUL to integrate all three together to show in the process order along with the running time.
At first I was going to suggest a new tool, but I think this works better as a configuration item. Some users, myself included, develop workflows with several containers intended to allow portions of the workflow to be turned on and off for the purpose of debug, more efficient development, etc. Managing which containers are enabled and disabled can become cumbersome and time-consuming.
I propose a new tab in the Workflow Configuration to allow the user to easily enable/disable containers. The Container configuration tab would list all containers by their tool number and caption. Each container would also have a state slider (Enabled/Disabled) that would show the current state of the container. The user could click any container's state slider to enable/disable as desired. An "all" slider that enabled/disabled all containers would also be helpful.
This enhancement would centralize container management and save developers a lot of time.
Thanks for your consideration.
It would be nice if we could use our gallery with a mobile app. We like to run demographics on site and have to pull up on the ipad.
Also, if instead of typing in an address, we could use the iphones "current location" option.
I know we have the capability to copy a Tool, and paste it into a Connection. This step requires having to right click on the connection to select the option Paste In Connection. I don't know how many times I've tried to copy tool, click on connection, and do Ctrl + V to paste just remember that it does work that way. It sure would be nice if it did.
The unique tool is great for removing duplicate items.
However, if wanting to identify and extract all items that have related duplicates (i.e. the unique item and the associated duplicates), I currently need to use a summarise tool with count, a filter tool to identify the duplicate items and join tool to link back to the original data set. It sometimes takes a few times to get the right combinations, and additional summarise and join tools are sometimes needed.
It would be great if there was a duplicates tool which worked like the unique tool (i.e. you can select the field to duplicate on) and pulled out the unique item together with the associated duplicates.
I was discussing these suggestions with our Account Manager last year and was advised that they would be taken into consideration for the planned 2018 Reporting upgrades. When I inquired about the status, I was advised to post here.
- Add “Freeze Panes” option
- RENDER multiple formatted Tables into 1 Excel file, each on its own NAMED tab (If you use the OUTPUT tool, you cannot format the data. If you RENDER you cannot name the tabs or export multiple tabs to one file)
- Changing the column width from “inches” to “number of characters”
There is a lot of usage of calendar events in business world. Having a native sync and input functions for popular calendar formats like ical or google calendars will save a lot of time
When users execute a sql statement via an input tool, the tool should be smart enough to invoke the (nolock) hint to avoid any database locking when querying a SQL database. Most users aren't advanced enough to understand how to do this in the SQL statement. It should be done automatically or at the very least, a check box option for user.
Hello all,
My localization settings :
Default Dictionnary in Order tool : Afrikaans


Best regards,
Simon
Hello,
here are my localization parameters, with a comma as a decimal separator :

However, is the overview in the formula tool

(I took the formula tool example)
The overview formatting should obviously match the formatting and give 206,95 and 207,00, instead of 206.95 and 207.00
Best regards,
Simon
Maybe I am a newbie, but it is really galling that the drop down tool in the interface palette wont show the values in a connected tool unless they are spun up as headers in a cross tab using a record ID ruse. Alteryx really needs to provide this very common use case. This functionality is so easy to implement and is a fundamental part of any UI. Take a field and show its values as a drop down. Please tell me I am missing something and that this is really easy. I know we can save it as a name value pair in a yxdb and then input that, but I should not have to do so many things for what is an essential function.
Would be great to have a find and replace option in the workflow. I've deployed a template workflow to maintain a datamart. I have about 50 sources which means about 50 workflows all very similar to each other. In fact its typically only table names that change. Would be cool to be able to open the template workflow and just do a find and replace on the name of the table. The find and replace could prompt me on each replace or I could do a replace all. This would be consistent with other apps like Excel.
The issue : we have to regurlary change our passwords. It implies changing it for all the connections alias (at least for standard connections).
What I'm looking for :
A commande line to execute like :
alteryxpw.exe -connection {alias name} -connection_type {user/system} -connection_mode {standard/indb} -pw {new password}
This command line could be executed by a powerhsell script.
Make it easier to use Delete and connect around
ex: Shift + Delete
Whilst not quite as efficient, the ability to overlay a line graph onto a scatter would enable the user to achieve a similar result as the points for the line can be calculated.
Sometimes on the "Join Tool" Interface in the Config screen.
You can not scroll down to read last item. The scroll bar is not at the bottom nor can be scrolled further down.

I suggest Alteryx may add a new interface tool / enhance existing date interface tool to allow selection of time period.
For the output of the interface tool, i believe we can simply concatenate the text (e.g. 111030AM) and perform transformation by other Alteryx tool.
The interface can be something like this, multiple drop down box which order in a single row.

Although there is workaround of creating 4 drop down box, but the presentation on Analytic app and gallery is not good (those text box is separated into multiple line.

- New Idea 207
- Accepting Votes 1,837
- Comments Requested 25
- Under Review 150
- Accepted 55
- Ongoing 7
- Coming Soon 8
- Implemented 473
- Not Planned 123
- Revisit 68
- Partner Dependent 4
- Inactive 674
-
Admin Settings
19 -
AMP Engine
27 -
API
11 -
API SDK
217 -
Category Address
13 -
Category Apps
111 -
Category Behavior Analysis
5 -
Category Calgary
21 -
Category Connectors
239 -
Category Data Investigation
75 -
Category Demographic Analysis
2 -
Category Developer
206 -
Category Documentation
77 -
Category In Database
212 -
Category Input Output
631 -
Category Interface
236 -
Category Join
101 -
Category Machine Learning
3 -
Category Macros
153 -
Category Parse
75 -
Category Predictive
76 -
Category Preparation
384 -
Category Prescriptive
1 -
Category Reporting
198 -
Category Spatial
80 -
Category Text Mining
23 -
Category Time Series
22 -
Category Transform
87 -
Configuration
1 -
Data Connectors
948 -
Desktop Experience
1,493 -
Documentation
64 -
Engine
121 -
Enhancement
274 -
Feature Request
212 -
General
307 -
General Suggestion
4 -
Insights Dataset
2 -
Installation
24 -
Licenses and Activation
15 -
Licensing
10 -
Localization
8 -
Location Intelligence
79 -
Machine Learning
13 -
New Request
177 -
New Tool
32 -
Permissions
1 -
Runtime
28 -
Scheduler
21 -
SDK
10 -
Setup & Configuration
58 -
Tool Improvement
210 -
User Experience Design
165 -
User Settings
73 -
UX
220 -
XML
7
- « Previous
- Next »
- vijayguru on: YXDB SQL Tool to fetch the required data
- Fabrice_P on: Hide/Unhide password button
- cjaneczko on: Adjustable Delay for Control Containers
-
 Watermark
on:
Dynamic Input: Check box to include a field with D...
Watermark
on:
Dynamic Input: Check box to include a field with D...
- aatalai on: cross tab special characters
- KamenRider on: Expand Character Limit of Email Fields to >254
- TimN on: When activate license key, display more informatio...
- simonaubert_bd on: Supporting QVDs
- simonaubert_bd on: In database : documentation for SQL field types ve...
- guth05 on: Search for Tool ID within a workflow