Alteryx Designer Desktop Discussions
Find answers, ask questions, and share expertise about Alteryx Designer Desktop and Intelligence Suite.- Community
- :
- Community
- :
- Participate
- :
- Discussions
- :
- Designer Desktop
- :
- Re: Interactive Chart - Change Bar Color Reverts ...
Interactive Chart - Change Bar Color Reverts to Original as Soon as You Change Another
- Subscribe to RSS Feed
- Mark Topic as New
- Mark Topic as Read
- Float this Topic for Current User
- Bookmark
- Subscribe
- Mute
- Printer Friendly Page
- Mark as New
- Bookmark
- Subscribe
- Mute
- Subscribe to RSS Feed
- Permalink
- Notify Moderator
Hi,
I am experimenting with the Interactive Chart Tool. All I want to do is change the colors of the series.
I am trying to change the color for each bar (series) in the Layer menu. I can change the color for a given bar (series), but it reverts to the original default color assigned as soon as I try to change the color of the next bar (series).
- Mark as New
- Bookmark
- Subscribe
- Mute
- Subscribe to RSS Feed
- Permalink
- Notify Moderator
I was not able to replicate your issue, and it works just fine on my side.
Can you upload your sample workflow to show us the issue?

- Mark as New
- Bookmark
- Subscribe
- Mute
- Subscribe to RSS Feed
- Permalink
- Notify Moderator
Hi @hellyars
Which version are you on. I know there was an issue with the colours in the interactive graph in one of the early 2020 versions
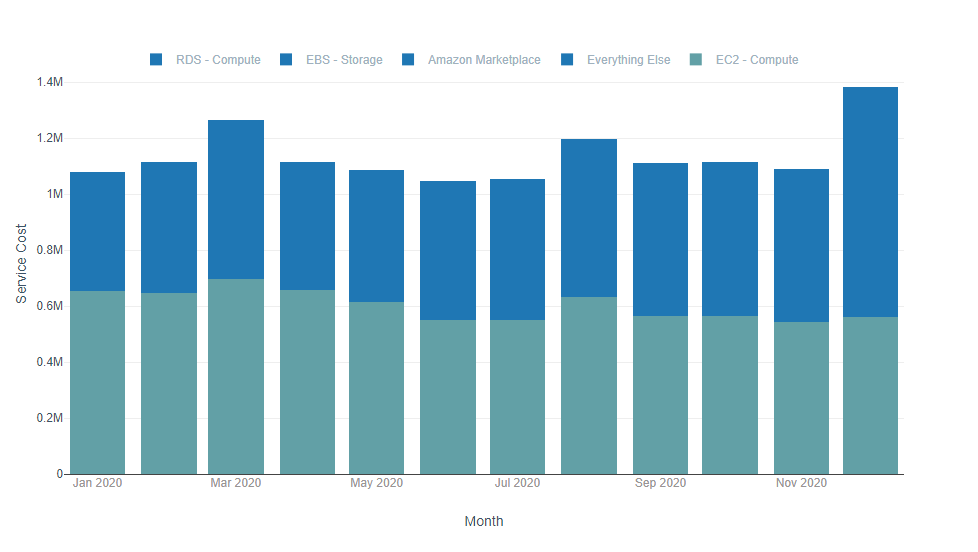
It's working correctly in 2020.3.5. i was able to create this hideous monstrosity

Dan
- Mark as New
- Bookmark
- Subscribe
- Mute
- Subscribe to RSS Feed
- Permalink
- Notify Moderator
@Qui. Those are exactly the controls I am using. I set one, it works. Change the second, and the first reverts to its default setting.
- Mark as New
- Bookmark
- Subscribe
- Mute
- Subscribe to RSS Feed
- Permalink
- Notify Moderator
@danilang The first change works. The second change forces the first change to revert.
I had to downgrade back to 2020.3.5 due to broken XML Parse Tool in 2020.4.
- Mark as New
- Bookmark
- Subscribe
- Mute
- Subscribe to RSS Feed
- Permalink
- Notify Moderator
- Mark as New
- Bookmark
- Subscribe
- Mute
- Subscribe to RSS Feed
- Permalink
- Notify Moderator
Hello @hellyars,
Thank you for posting this. I submitted the issue with interactive chart to our product team. They will look into it and hopefully it will be fixed soon. Sorry about any inconvenience!
- Mark as New
- Bookmark
- Subscribe
- Mute
- Subscribe to RSS Feed
- Permalink
- Notify Moderator
Do we have a resolution for this yet?
- Mark as New
- Bookmark
- Subscribe
- Mute
- Subscribe to RSS Feed
- Permalink
- Notify Moderator
I am currently running into the same issue on 2020.4.5
- Mark as New
- Bookmark
- Subscribe
- Mute
- Subscribe to RSS Feed
- Permalink
- Notify Moderator
I am having the same issue on 2020.2.3

-
AAH
1 -
AAH Welcome
2 -
Academy
24 -
ADAPT
82 -
Add column
1 -
Administration
20 -
Adobe
174 -
Advanced Analytics
1 -
Advent of Code
5 -
Alias Manager
69 -
Alteryx
1 -
Alteryx 2020.1
3 -
Alteryx Academy
3 -
Alteryx Analytics
1 -
Alteryx Analytics Hub
2 -
Alteryx Community Introduction - MSA student at CSUF
1 -
Alteryx Connect
1 -
Alteryx Designer
44 -
Alteryx Engine
1 -
Alteryx Gallery
1 -
Alteryx Hub
1 -
alteryx open source
1 -
Alteryx Post response
1 -
Alteryx Practice
134 -
Alteryx team
1 -
Alteryx Tools
1 -
AlteryxForGood
1 -
Amazon s3
135 -
AMP Engine
187 -
ANALYSTE INNOVATEUR
1 -
Analytic App Support
1 -
Analytic Apps
17 -
Analytic Apps ACT
1 -
Analytics
2 -
Analyzer
17 -
Announcement
4 -
API
1,036 -
App
1 -
App Builder
42 -
Append Fields
1 -
Apps
1,165 -
Archiving process
1 -
ARIMA
1 -
Assigning metadata to CSV
1 -
Authentication
4 -
Automatic Update
1 -
Automating
3 -
Banking
1 -
Base64Encoding
1 -
Basic Table Reporting
1 -
Batch Macro
1,265 -
Beginner
1 -
Behavior Analysis
216 -
Best Practices
2,403 -
BI + Analytics + Data Science
1 -
Book Worm
2 -
Bug
619 -
Bugs & Issues
2 -
Calgary
58 -
CASS
45 -
Cat Person
1 -
Category Documentation
1 -
Category Input Output
2 -
Certification
4 -
Chained App
233 -
Challenge
7 -
Charting
1 -
Clients
3 -
Clustering
1 -
Common Use Cases
3,378 -
Communications
1 -
Community
188 -
Computer Vision
44 -
Concatenate
1 -
Conditional Column
1 -
Conditional statement
1 -
CONNECT AND SOLVE
1 -
Connecting
6 -
Connectors
1,173 -
Content Management
8 -
Contest
6 -
Conversation Starter
17 -
copy
1 -
COVID-19
4 -
Create a new spreadsheet by using exising data set
1 -
Credential Management
3 -
Curious*Little
1 -
Custom Formula Function
1 -
Custom Tools
1,712 -
Dash Board Creation
1 -
Data Analyse
1 -
Data Analysis
2 -
Data Analytics
1 -
Data Challenge
83 -
Data Cleansing
4 -
Data Connection
1 -
Data Investigation
3,040 -
Data Load
1 -
Data Science
38 -
Database Connection
1,887 -
Database Connections
5 -
Datasets
4,559 -
Date
3 -
Date and Time
3 -
date format
2 -
Date selection
2 -
Date Time
2,872 -
Dateformat
1 -
dates
1 -
datetimeparse
2 -
Defect
2 -
Demographic Analysis
172 -
Designer
1 -
Designer Cloud
469 -
Designer Integration
60 -
Developer
3,629 -
Developer Tools
2,903 -
Discussion
2 -
Documentation
449 -
Dog Person
4 -
Download
900 -
Duplicates rows
1 -
Duplicating rows
1 -
Dynamic
1 -
Dynamic Input
1 -
Dynamic Name
1 -
Dynamic Processing
2,520 -
dynamic replace
1 -
dynamically create tables for input files
1 -
Dynamically select column from excel
1 -
Email
740 -
Email Notification
1 -
Email Tool
2 -
Embed
1 -
embedded
1 -
Engine
129 -
Enhancement
3 -
Enhancements
2 -
Error Message
1,967 -
Error Messages
6 -
ETS
1 -
Events
176 -
Excel
1 -
Excel dynamically merge
1 -
Excel Macro
1 -
Excel Users
1 -
Explorer
2 -
Expression
1,689 -
extract data
1 -
Feature Request
1 -
Filter
1 -
filter join
1 -
Financial Services
1 -
Foodie
2 -
Formula
2 -
formula or filter
1 -
Formula Tool
4 -
Formulas
2 -
Fun
4 -
Fuzzy Match
613 -
Fuzzy Matching
1 -
Gallery
586 -
General
93 -
General Suggestion
1 -
Generate Row and Multi-Row Formulas
1 -
Generate Rows
1 -
Getting Started
1 -
Google Analytics
139 -
grouping
1 -
Guidelines
11 -
Hello Everyone !
2 -
Help
4,095 -
How do I colour fields in a row based on a value in another column
1 -
How-To
1 -
Hub 20.4
2 -
I am new to Alteryx.
1 -
identifier
1 -
In Database
852 -
In-Database
1 -
Input
3,703 -
Input data
2 -
Inserting New Rows
1 -
Install
3 -
Installation
305 -
Interface
2 -
Interface Tools
1,639 -
Introduction
5 -
Iterative Macro
946 -
Jira connector
1 -
Join
1,731 -
knowledge base
1 -
Licenses
1 -
Licensing
210 -
List Runner
1 -
Loaders
12 -
Loaders SDK
1 -
Location Optimizer
52 -
Lookup
1 -
Machine Learning
230 -
Macro
2 -
Macros
2,491 -
Mapping
1 -
Marketo
12 -
Marketplace
4 -
matching
1 -
Merging
1 -
MongoDB
66 -
Multiple variable creation
1 -
MultiRowFormula
1 -
Need assistance
1 -
need help :How find a specific string in the all the column of excel and return that clmn
1 -
Need help on Formula Tool
1 -
network
1 -
News
1 -
None of your Business
1 -
Numeric values not appearing
1 -
ODBC
1 -
Off-Topic
14 -
Office of Finance
1 -
Oil & Gas
1 -
Optimization
645 -
Output
4,491 -
Output Data
1 -
package
1 -
Parse
2,092 -
Pattern Matching
1 -
People Person
6 -
percentiles
1 -
Power BI
197 -
practice exercises
1 -
Predictive
2 -
Predictive Analysis
818 -
Predictive Analytics
1 -
Preparation
4,620 -
Prescriptive Analytics
185 -
Publish
228 -
Publishing
2 -
Python
726 -
Qlik
35 -
quartiles
1 -
query editor
1 -
Question
18 -
Questions
1 -
R Tool
452 -
refresh issue
1 -
RegEx
2,101 -
Remove column
1 -
Reporting
2,107 -
Resource
15 -
RestAPI
1 -
Role Management
3 -
Run Command
499 -
Run Workflows
10 -
Runtime
1 -
Salesforce
242 -
Sampling
1 -
Schedule Workflows
3 -
Scheduler
371 -
Scientist
1 -
Search
3 -
Search Feedback
20 -
Server
523 -
Settings
756 -
Setup & Configuration
47 -
Sharepoint
463 -
Sharing
2 -
Sharing & Reuse
1 -
Snowflake
1 -
Spatial
1 -
Spatial Analysis
555 -
Student
9 -
Styling Issue
1 -
Subtotal
1 -
System Administration
1 -
Tableau
461 -
Tables
1 -
Technology
1 -
Text Mining
408 -
Thumbnail
1 -
Thursday Thought
10 -
Time Series
397 -
Time Series Forecasting
1 -
Tips and Tricks
3,774 -
Tool Improvement
1 -
Topic of Interest
40 -
Transformation
3,198 -
Transforming
3 -
Transpose
1 -
Truncating number from a string
1 -
Twitter
24 -
Udacity
85 -
Unique
2 -
Unsure on approach
1 -
Update
1 -
Updates
2 -
Upgrades
1 -
URL
1 -
Use Cases
1 -
User Interface
21 -
User Management
4 -
Video
2 -
VideoID
1 -
Vlookup
1 -
Weekly Challenge
1 -
Weibull Distribution Weibull.Dist
1 -
Word count
1 -
Workflow
8,428 -
Workflows
1 -
YearFrac
1 -
YouTube
1 -
YTD and QTD
1
- « Previous
- Next »