Alteryx Designer Desktop Discussions
Find answers, ask questions, and share expertise about Alteryx Designer Desktop and Intelligence Suite.- Community
- :
- Community
- :
- Participate
- :
- Discussions
- :
- Designer Desktop
- :
- Re: Batch macro. and multiple filters to create ra...
Batch macro. and multiple filters to create ranks and percentiles
- Subscribe to RSS Feed
- Mark Topic as New
- Mark Topic as Read
- Float this Topic for Current User
- Bookmark
- Subscribe
- Mute
- Printer Friendly Page
- Mark as New
- Bookmark
- Subscribe
- Mute
- Subscribe to RSS Feed
- Permalink
- Notify Moderator
I thought I cracked it with this macro but alas not.
I am trying to create a macro that creates median, quartiles and ranks for different subgroups (I am analyzing a large data file where there are 30+ subgroups for which I need to do these calculations).
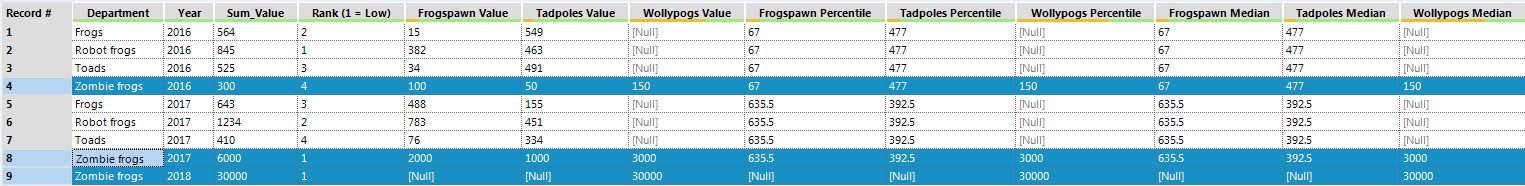
The output structure I am looking for would be a single line per department per year with columns for value, percentile and median for each measure. What I have created so far s a long table of repeated data.
I have tried looking into the Tile tool as an alternative but I got stuck on how to identify the values for the tile splits.
Many thanks in advance for any suggestions
Solved! Go to Solution.
- Labels:
-
Batch Macro

- Mark as New
- Bookmark
- Subscribe
- Mute
- Subscribe to RSS Feed
- Permalink
- Notify Moderator
Hi @chickenlicken!
Is the rank meant to be calculated across the department and year? And the percentile/median across year and measure? If so, I think something like this might work for you.


Let us know if this gets you closer. If not, please provide a sample of what you want the output to look like.
- Mark as New
- Bookmark
- Subscribe
- Mute
- Subscribe to RSS Feed
- Permalink
- Notify Moderator
HI @ddiesel, thanks for this. This is the output I am looking for. The trouble is that for my larger workflow, there are many measures and submeasures (~100) and I was looking for a method that means I do not have to use the Summarize function and manually reconfigure the workflow each time for each group.
Would I be able to use this type of workflow as a macro?
Thanks for your help!
- Mark as New
- Bookmark
- Subscribe
- Mute
- Subscribe to RSS Feed
- Permalink
- Notify Moderator
Is it possible to use the multi-row tool to create subtotals and quartiles, rather than the Summarize tool?
- Mark as New
- Bookmark
- Subscribe
- Mute
- Subscribe to RSS Feed
- Permalink
- Notify Moderator
Hi @chickenlicken! The workflow is designed to be dynamic across Departments, Years, and Measures.
Example:
Zombie Frogs and Wollypogs in-

Zombie Frogs and Wollypogs out-

Summarize (7) that summarizes the data by Department and Year might need adjusting for the calculations you need. Percentile_Value and Median_Value are equal. I'm not sure what you need calculated here, and I'm not sure how the multi-row formula would apply.
Try this out. If it's still not working for you, please provide a good sample input/output.
- Mark as New
- Bookmark
- Subscribe
- Mute
- Subscribe to RSS Feed
- Permalink
- Notify Moderator
Also please explain the submeasure part. How do you need the measures calculated across which years, departments, and measures?
- Mark as New
- Bookmark
- Subscribe
- Mute
- Subscribe to RSS Feed
- Permalink
- Notify Moderator
Thank you! I looked more closely at your solution and it works with my larger data set - I had been massively overcomplicating things and using about 10 tools where just one summarize would do. You are a life saver.
- Mark as New
- Bookmark
- Subscribe
- Mute
- Subscribe to RSS Feed
- Permalink
- Notify Moderator
You're welcome! I'm glad it worked out for you.


-
AAH
1 -
AAH Welcome
2 -
Academy
24 -
ADAPT
82 -
Add column
1 -
Administration
20 -
Adobe
175 -
Advanced Analytics
1 -
Advent of Code
5 -
Alias Manager
69 -
Alteryx
1 -
Alteryx 2020.1
3 -
Alteryx Academy
3 -
Alteryx Analytics
1 -
Alteryx Analytics Hub
2 -
Alteryx Community Introduction - MSA student at CSUF
1 -
Alteryx Connect
1 -
Alteryx Designer
44 -
Alteryx Engine
1 -
Alteryx Gallery
1 -
Alteryx Hub
1 -
alteryx open source
1 -
Alteryx Post response
1 -
Alteryx Practice
134 -
Alteryx team
1 -
Alteryx Tools
1 -
AlteryxForGood
1 -
Amazon s3
137 -
AMP Engine
189 -
ANALYSTE INNOVATEUR
1 -
Analytic App Support
1 -
Analytic Apps
17 -
Analytic Apps ACT
1 -
Analytics
2 -
Analyzer
17 -
Announcement
4 -
API
1,037 -
App
1 -
App Builder
42 -
Append Fields
1 -
Apps
1,166 -
Archiving process
1 -
ARIMA
1 -
Assigning metadata to CSV
1 -
Authentication
4 -
Automatic Update
1 -
Automating
3 -
Banking
1 -
Base64Encoding
1 -
Basic Table Reporting
1 -
Batch Macro
1,268 -
Beginner
1 -
Behavior Analysis
216 -
Best Practices
2,410 -
BI + Analytics + Data Science
1 -
Book Worm
2 -
Bug
620 -
Bugs & Issues
2 -
Calgary
58 -
CASS
45 -
Cat Person
1 -
Category Documentation
1 -
Category Input Output
2 -
Certification
4 -
Chained App
234 -
Challenge
7 -
Charting
1 -
Clients
3 -
Clustering
1 -
Common Use Cases
3,384 -
Communications
1 -
Community
188 -
Computer Vision
44 -
Concatenate
1 -
Conditional Column
1 -
Conditional statement
1 -
CONNECT AND SOLVE
1 -
Connecting
6 -
Connectors
1,178 -
Content Management
8 -
Contest
6 -
Conversation Starter
17 -
copy
1 -
COVID-19
4 -
Create a new spreadsheet by using exising data set
1 -
Credential Management
3 -
Curious*Little
1 -
Custom Formula Function
1 -
Custom Tools
1,717 -
Dash Board Creation
1 -
Data Analyse
1 -
Data Analysis
2 -
Data Analytics
1 -
Data Challenge
83 -
Data Cleansing
4 -
Data Connection
1 -
Data Investigation
3,053 -
Data Load
1 -
Data Science
38 -
Database Connection
1,896 -
Database Connections
5 -
Datasets
4,567 -
Date
3 -
Date and Time
3 -
date format
2 -
Date selection
2 -
Date Time
2,880 -
Dateformat
1 -
dates
1 -
datetimeparse
2 -
Defect
2 -
Demographic Analysis
172 -
Designer
1 -
Designer Cloud
471 -
Designer Integration
60 -
Developer
3,638 -
Developer Tools
2,912 -
Discussion
2 -
Documentation
452 -
Dog Person
4 -
Download
906 -
Duplicates rows
1 -
Duplicating rows
1 -
Dynamic
1 -
Dynamic Input
1 -
Dynamic Name
1 -
Dynamic Processing
2,530 -
dynamic replace
1 -
dynamically create tables for input files
1 -
Dynamically select column from excel
1 -
Email
742 -
Email Notification
1 -
Email Tool
2 -
Embed
1 -
embedded
1 -
Engine
129 -
Enhancement
3 -
Enhancements
2 -
Error Message
1,974 -
Error Messages
6 -
ETS
1 -
Events
178 -
Excel
1 -
Excel dynamically merge
1 -
Excel Macro
1 -
Excel Users
1 -
Explorer
2 -
Expression
1,693 -
extract data
1 -
Feature Request
1 -
Filter
1 -
filter join
1 -
Financial Services
1 -
Foodie
2 -
Formula
2 -
formula or filter
1 -
Formula Tool
4 -
Formulas
2 -
Fun
4 -
Fuzzy Match
614 -
Fuzzy Matching
1 -
Gallery
588 -
General
93 -
General Suggestion
1 -
Generate Row and Multi-Row Formulas
1 -
Generate Rows
1 -
Getting Started
1 -
Google Analytics
140 -
grouping
1 -
Guidelines
11 -
Hello Everyone !
2 -
Help
4,107 -
How do I colour fields in a row based on a value in another column
1 -
How-To
1 -
Hub 20.4
2 -
I am new to Alteryx.
1 -
identifier
1 -
In Database
854 -
In-Database
1 -
Input
3,710 -
Input data
2 -
Inserting New Rows
1 -
Install
3 -
Installation
305 -
Interface
2 -
Interface Tools
1,644 -
Introduction
5 -
Iterative Macro
949 -
Jira connector
1 -
Join
1,734 -
knowledge base
1 -
Licenses
1 -
Licensing
210 -
List Runner
1 -
Loaders
12 -
Loaders SDK
1 -
Location Optimizer
52 -
Lookup
1 -
Machine Learning
230 -
Macro
2 -
Macros
2,495 -
Mapping
1 -
Marketo
12 -
Marketplace
4 -
matching
1 -
Merging
1 -
MongoDB
66 -
Multiple variable creation
1 -
MultiRowFormula
1 -
Need assistance
1 -
need help :How find a specific string in the all the column of excel and return that clmn
1 -
Need help on Formula Tool
1 -
network
1 -
News
1 -
None of your Business
1 -
Numeric values not appearing
1 -
ODBC
1 -
Off-Topic
14 -
Office of Finance
1 -
Oil & Gas
1 -
Optimization
646 -
Output
4,497 -
Output Data
1 -
package
1 -
Parse
2,096 -
Pattern Matching
1 -
People Person
6 -
percentiles
1 -
Power BI
197 -
practice exercises
1 -
Predictive
2 -
Predictive Analysis
819 -
Predictive Analytics
1 -
Preparation
4,630 -
Prescriptive Analytics
185 -
Publish
230 -
Publishing
2 -
Python
728 -
Qlik
36 -
quartiles
1 -
query editor
1 -
Question
18 -
Questions
1 -
R Tool
452 -
refresh issue
1 -
RegEx
2,103 -
Remove column
1 -
Reporting
2,109 -
Resource
15 -
RestAPI
1 -
Role Management
3 -
Run Command
500 -
Run Workflows
10 -
Runtime
1 -
Salesforce
242 -
Sampling
1 -
Schedule Workflows
3 -
Scheduler
372 -
Scientist
1 -
Search
3 -
Search Feedback
20 -
Server
524 -
Settings
758 -
Setup & Configuration
47 -
Sharepoint
464 -
Sharing
2 -
Sharing & Reuse
1 -
Snowflake
1 -
Spatial
1 -
Spatial Analysis
556 -
Student
9 -
Styling Issue
1 -
Subtotal
1 -
System Administration
1 -
Tableau
461 -
Tables
1 -
Technology
1 -
Text Mining
409 -
Thumbnail
1 -
Thursday Thought
10 -
Time Series
397 -
Time Series Forecasting
1 -
Tips and Tricks
3,780 -
Tool Improvement
1 -
Topic of Interest
40 -
Transformation
3,209 -
Transforming
3 -
Transpose
1 -
Truncating number from a string
1 -
Twitter
24 -
Udacity
85 -
Unique
2 -
Unsure on approach
1 -
Update
1 -
Updates
2 -
Upgrades
1 -
URL
1 -
Use Cases
1 -
User Interface
21 -
User Management
4 -
Video
2 -
VideoID
1 -
Vlookup
1 -
Weekly Challenge
1 -
Weibull Distribution Weibull.Dist
1 -
Word count
1 -
Workflow
8,460 -
Workflows
1 -
YearFrac
1 -
YouTube
1 -
YTD and QTD
1
- « Previous
- Next »