Alteryx Designer Desktop Discussions
Find answers, ask questions, and share expertise about Alteryx Designer Desktop and Intelligence Suite.- Community
- :
- Community
- :
- Participate
- :
- Discussions
- :
- Designer Desktop
- :
- Re: Alteryx Automated Workflow for survey question...
Alteryx Automated Workflow for survey questions
- Subscribe to RSS Feed
- Mark Topic as New
- Mark Topic as Read
- Float this Topic for Current User
- Bookmark
- Subscribe
- Mute
- Printer Friendly Page
- Mark as New
- Bookmark
- Subscribe
- Mute
- Subscribe to RSS Feed
- Permalink
- Notify Moderator
A survey was conducted on 500 respondents and asked six questions in the survey (Details
in “Data dictionary” appendix on page 2 attached file CS1 data). The company needs to identify the % of respondents who answered 4 or 5 in each “Domain area” (Question 6).
Need help in designing an Alteryx workflow for the data manipulation on the survey question (q6).
- Labels:
-
Developer
- Mark as New
- Bookmark
- Subscribe
- Mute
- Subscribe to RSS Feed
- Permalink
- Notify Moderator
hi @vinamra101 ,
I went ahead and built out a solution that gives you the % of respondents who answered 4 or 5 in each “Domain area”. See attached workflow. I used the multi-field formula tool to create a flag for anytime a 4 or a 5 was identified in any of the domain area columns, and then used some tools from the Transform category to pivot and manipulate the data accordingly:

Let me know if this helps!
- Mark as New
- Bookmark
- Subscribe
- Mute
- Subscribe to RSS Feed
- Permalink
- Notify Moderator
Hi @Danny S,
Thank you so much for the workflow. You are the best.
Is it possible to transform the output in form of data extract which can be directly used in tableau for visualization.
Also, is it possible to pivot the data with the original file ?
The end product in tableau looks the attached image. All in all can the cleansed data be pivoted with the original data? So that it can be easily transformed to visualization.
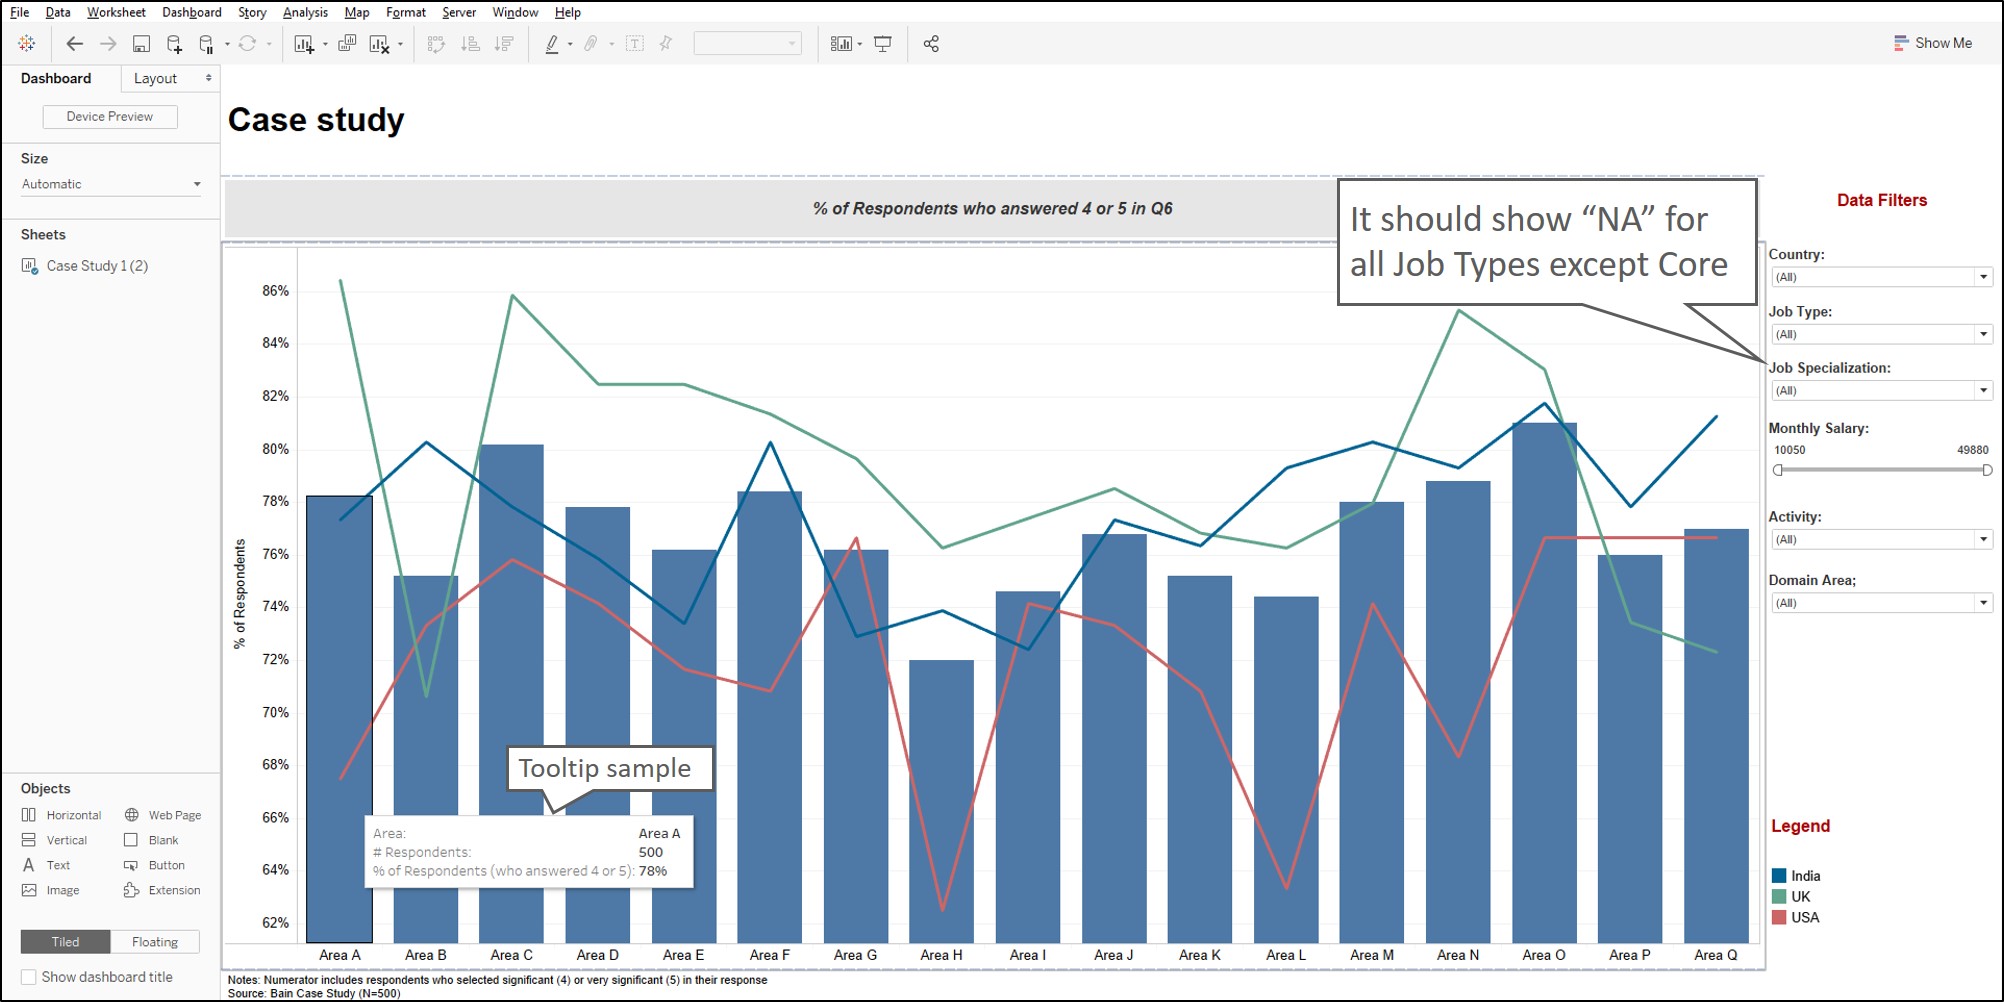
- Mark as New
- Bookmark
- Subscribe
- Mute
- Subscribe to RSS Feed
- Permalink
- Notify Moderator
Basically the data will be cleansed and prepared. This prepared data shall need to uploaded to tableau either through an excel file or a tableau data source. All of this process has to be done using Alteryx automated workflow


-
AAH
1 -
AAH Welcome
2 -
Academy
24 -
ADAPT
82 -
Add column
1 -
Administration
20 -
Adobe
176 -
Advanced Analytics
1 -
Advent of Code
5 -
Alias Manager
70 -
Alteryx
1 -
Alteryx 2020.1
3 -
Alteryx Academy
3 -
Alteryx Analytics
1 -
Alteryx Analytics Hub
2 -
Alteryx Community Introduction - MSA student at CSUF
1 -
Alteryx Connect
1 -
Alteryx Designer
44 -
Alteryx Engine
1 -
Alteryx Gallery
1 -
Alteryx Hub
1 -
alteryx open source
1 -
Alteryx Post response
1 -
Alteryx Practice
134 -
Alteryx team
1 -
Alteryx Tools
1 -
AlteryxForGood
1 -
Amazon s3
138 -
AMP Engine
190 -
ANALYSTE INNOVATEUR
1 -
Analytic App Support
1 -
Analytic Apps
17 -
Analytic Apps ACT
1 -
Analytics
2 -
Analyzer
17 -
Announcement
4 -
API
1,038 -
App
1 -
App Builder
43 -
Append Fields
1 -
Apps
1,167 -
Archiving process
1 -
ARIMA
1 -
Assigning metadata to CSV
1 -
Authentication
4 -
Automatic Update
1 -
Automating
3 -
Banking
1 -
Base64Encoding
1 -
Basic Table Reporting
1 -
Batch Macro
1,271 -
Beginner
1 -
Behavior Analysis
217 -
Best Practices
2,412 -
BI + Analytics + Data Science
1 -
Book Worm
2 -
Bug
622 -
Bugs & Issues
2 -
Calgary
59 -
CASS
46 -
Cat Person
1 -
Category Documentation
1 -
Category Input Output
2 -
Certification
4 -
Chained App
235 -
Challenge
7 -
Charting
1 -
Clients
3 -
Clustering
1 -
Common Use Cases
3,386 -
Communications
1 -
Community
188 -
Computer Vision
45 -
Concatenate
1 -
Conditional Column
1 -
Conditional statement
1 -
CONNECT AND SOLVE
1 -
Connecting
6 -
Connectors
1,179 -
Content Management
8 -
Contest
6 -
Conversation Starter
17 -
copy
1 -
COVID-19
4 -
Create a new spreadsheet by using exising data set
1 -
Credential Management
3 -
Curious*Little
1 -
Custom Formula Function
1 -
Custom Tools
1,719 -
Dash Board Creation
1 -
Data Analyse
1 -
Data Analysis
2 -
Data Analytics
1 -
Data Challenge
83 -
Data Cleansing
4 -
Data Connection
1 -
Data Investigation
3,059 -
Data Load
1 -
Data Science
38 -
Database Connection
1,898 -
Database Connections
5 -
Datasets
4,572 -
Date
3 -
Date and Time
3 -
date format
2 -
Date selection
2 -
Date Time
2,880 -
Dateformat
1 -
dates
1 -
datetimeparse
2 -
Defect
2 -
Demographic Analysis
172 -
Designer
1 -
Designer Cloud
472 -
Designer Integration
60 -
Developer
3,642 -
Developer Tools
2,916 -
Discussion
2 -
Documentation
452 -
Dog Person
4 -
Download
906 -
Duplicates rows
1 -
Duplicating rows
1 -
Dynamic
1 -
Dynamic Input
1 -
Dynamic Name
1 -
Dynamic Processing
2,535 -
dynamic replace
1 -
dynamically create tables for input files
1 -
Dynamically select column from excel
1 -
Email
742 -
Email Notification
1 -
Email Tool
2 -
Embed
1 -
embedded
1 -
Engine
129 -
Enhancement
3 -
Enhancements
2 -
Error Message
1,976 -
Error Messages
6 -
ETS
1 -
Events
178 -
Excel
1 -
Excel dynamically merge
1 -
Excel Macro
1 -
Excel Users
1 -
Explorer
2 -
Expression
1,693 -
extract data
1 -
Feature Request
1 -
Filter
1 -
filter join
1 -
Financial Services
1 -
Foodie
2 -
Formula
2 -
formula or filter
1 -
Formula Tool
4 -
Formulas
2 -
Fun
4 -
Fuzzy Match
614 -
Fuzzy Matching
1 -
Gallery
588 -
General
93 -
General Suggestion
1 -
Generate Row and Multi-Row Formulas
1 -
Generate Rows
1 -
Getting Started
1 -
Google Analytics
140 -
grouping
1 -
Guidelines
11 -
Hello Everyone !
2 -
Help
4,112 -
How do I colour fields in a row based on a value in another column
1 -
How-To
1 -
Hub 20.4
2 -
I am new to Alteryx.
1 -
identifier
1 -
In Database
854 -
In-Database
1 -
Input
3,711 -
Input data
2 -
Inserting New Rows
1 -
Install
3 -
Installation
305 -
Interface
2 -
Interface Tools
1,644 -
Introduction
5 -
Iterative Macro
950 -
Jira connector
1 -
Join
1,736 -
knowledge base
1 -
Licenses
1 -
Licensing
210 -
List Runner
1 -
Loaders
12 -
Loaders SDK
1 -
Location Optimizer
52 -
Lookup
1 -
Machine Learning
230 -
Macro
2 -
Macros
2,498 -
Mapping
1 -
Marketo
12 -
Marketplace
4 -
matching
1 -
Merging
1 -
MongoDB
66 -
Multiple variable creation
1 -
MultiRowFormula
1 -
Need assistance
1 -
need help :How find a specific string in the all the column of excel and return that clmn
1 -
Need help on Formula Tool
1 -
network
1 -
News
1 -
None of your Business
1 -
Numeric values not appearing
1 -
ODBC
1 -
Off-Topic
14 -
Office of Finance
1 -
Oil & Gas
1 -
Optimization
647 -
Output
4,502 -
Output Data
1 -
package
1 -
Parse
2,099 -
Pattern Matching
1 -
People Person
6 -
percentiles
1 -
Power BI
197 -
practice exercises
1 -
Predictive
2 -
Predictive Analysis
820 -
Predictive Analytics
1 -
Preparation
4,631 -
Prescriptive Analytics
185 -
Publish
230 -
Publishing
2 -
Python
728 -
Qlik
36 -
quartiles
1 -
query editor
1 -
Question
18 -
Questions
1 -
R Tool
452 -
refresh issue
1 -
RegEx
2,106 -
Remove column
1 -
Reporting
2,112 -
Resource
15 -
RestAPI
1 -
Role Management
3 -
Run Command
501 -
Run Workflows
10 -
Runtime
1 -
Salesforce
243 -
Sampling
1 -
Schedule Workflows
3 -
Scheduler
372 -
Scientist
1 -
Search
3 -
Search Feedback
20 -
Server
524 -
Settings
758 -
Setup & Configuration
47 -
Sharepoint
465 -
Sharing
2 -
Sharing & Reuse
1 -
Snowflake
1 -
Spatial
1 -
Spatial Analysis
556 -
Student
9 -
Styling Issue
1 -
Subtotal
1 -
System Administration
1 -
Tableau
462 -
Tables
1 -
Technology
1 -
Text Mining
410 -
Thumbnail
1 -
Thursday Thought
10 -
Time Series
397 -
Time Series Forecasting
1 -
Tips and Tricks
3,781 -
Tool Improvement
1 -
Topic of Interest
40 -
Transformation
3,212 -
Transforming
3 -
Transpose
1 -
Truncating number from a string
1 -
Twitter
24 -
Udacity
85 -
Unique
2 -
Unsure on approach
1 -
Update
1 -
Updates
2 -
Upgrades
1 -
URL
1 -
Use Cases
1 -
User Interface
21 -
User Management
4 -
Video
2 -
VideoID
1 -
Vlookup
1 -
Weekly Challenge
1 -
Weibull Distribution Weibull.Dist
1 -
Word count
1 -
Workflow
8,469 -
Workflows
1 -
YearFrac
1 -
YouTube
1 -
YTD and QTD
1
- « Previous
- Next »