Search
Close
Free Trial
Turn on suggestions
Auto-suggest helps you quickly narrow down your search results by suggesting possible matches as you type.
Showing results for
Certification
Digital Learning
Solve the challenge, share your solution and summit the ranks of our Community!
Also available in |
Français |
Português |
Español |
日本語
Elevate your workflow skills by solving real-world challenges using the Alteryx Analytics Cloud Platform.
Dive into new analytics techniques with lessons that incorporate videos, hands-on activities and quizzes to assess your knowledge.
Also available in...
Featured
Activity Feed
A solution to last week's challenge can be found here.
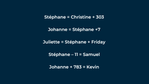
This week's challenge focuses on a group of relatives and their birthdays. Of the six family members, we have one person's date of birth and a series of clues to calculate the others. Provide the DOB for all family members and the day of the week s/he was born.
... View more
Labels:
23
443
The link to the solution for last challenge #35 is HERE.
Use Case: An analytical consulting company downloads medical journal publication data from the web and would like to extract all of the authors for the listed entries.
The text input contains details about each article where FAU indicates the author name for the article – in most case there are multiple authors. The details of each article are contained in lines that begin with PMID and end with an empty line.
Objective: Parse out each article PMID and list each author in sequential columns as seen in the Results.yxmd file.
... View more
Labels:
17
524
A solution to last week's challenge can be found here!
Using the data provided in the start file, create an ordered list of the provided unofficial holidays.
GIPHY
Get ready for Answer the Phone like Buddy the Elf Day on December 18!
... View more

Labels:
55
1,223
Hi Maveryx,
We posted the solution JSON file to Cloud Quest #5. Check it out and let us know what you think! Send suggestions to academy@alteryx.com or leave a comment below.
Let’s dive into this week's quest!
Download the provided JSON start file and upload it into your Analytics Cloud library. For more detailed instructions on how to import and export Designer Cloud workflow files, check out the pinned article .
Scenario:
This week’s quest revolves around data provided about standardized math exams administered in New York City Public Schools from 2013 to 2019. Download the provided district_math_results.csv dataset and reconnect it in your starting workflow file. Ensure that the Interpret Column Datatypes checkbox is not selected in the Input Data tool options. The dataset includes details on the district, grade, year, category (male/female); the number of students who took the test; and the percentage of students who achieved each level, with Level 4 being the highest.
You have two tasks:
Calculate the change, by district, in the percentage of 8th grade female students who achieved a Level 4 score in 2019 compared to 2013.
Identify the top three districts that showed the most significant improvement in the Level 4 percentage over the same period.
Hint: Configure the Cross Tab tool to create a new column based on the Year field, labeling the columns as Year 2013 and Year 2019. The Level 4 percentage should serve as the value for these columns, using the Use First Value method. Ensure the data is grouped by District.
A combination of the Sample, Filter, Cross Tab, Formula, and Select tools should solve your problem, but not necessarily in this sequence.
A combination of the Sample, Filter, Cross Tab, Formula, and Select tools should solve your problem, but not necessarily in this sequence.
If you find yourself struggling with any of the tasks, feel free to explore these interactive lessons in the Maveryx Academy for guidance:
Getting Started with Designer Cloud
Building Connections in Designer Cloud
Building Your Workflow in Designer Cloud
Once you have completed your quest, go back to your Analytics Cloud library. Download your workflow solution file. Include your JSON file and workflow screenshot as attachments to your comment.
Here’s to a successful quest!
Source: https://infohub.nyced.org/docs/default-source/default-document-library/2014-15-to-2022-23-nyc-regents-overall-and-by-category---public.xlsx
... View more

Labels:
2
9
Hi Maveryx,
A solution to last week’s challenge can be found here.
In April, we celebrate Earth Month, a time dedicated to raising awareness and taking action for environmental conservation and sustainability.
This weekly challenge delves into temperatures, highlighting their crucial role in our planet's health. The dataset presents comprehensive information on global temperature records, covering various countries worldwide. It includes average temperature records in Celsius for major cities from 1743 to 2013.
To solve this challenge, we will be concentrating on the data from 1950 onwards.
Your tasks are as follows:
Determine which cities have average temperatures greater than or equal to 25 degrees.
Among the cities identified in the previous task, identify the country with the highest number of such cities.
Examining all countries within the dataset, pinpoint the year with the highest average temperature and the year with the lowest average temperature across the globe.
Need a refresher? Review these lessons in Academy to gear up:
Sorting Data
Separating Data into Columns and Rows
Summarizing Data
Source: https://www.kaggle.com/datasets/maso0dahmed/global-temperature-records-1850-2022
Good luck!
... View more


Labels:
- Labels:
- Basic
- Core
- Data Analysis
5
55