Search
Close
Free Trial
Turn on suggestions
Auto-suggest helps you quickly narrow down your search results by suggesting possible matches as you type.
Showing results for
Certification
Digital Learning
Solve the challenge, share your solution and summit the ranks of our Community!
Also available in |
Français |
Português |
Español |
日本語
Elevate your workflow skills by solving real-world challenges using the Alteryx Analytics Cloud Platform.
Dive into new analytics techniques with lessons that incorporate videos, hands-on activities and quizzes to assess your knowledge.
Also available in...
Featured
Activity Feed
A solution to last week’s challenge can be found here.
Are you wondering which artists produced the top songs? Do you want some insights? This challenge is for you.
The following dataset contains information about the top 500 songs. Using the dataset, find the top 50 artists with the most albums and the highest average rating. Include the following columns in your list :
- Artist(s) - Number of albums (Descending) - Average rating based on all albums (Descending) - Album title(s) - Average number of reviews based on all albums (Descending) - Genre(s) - Year the first album was released - Year the last album was released
Note: If in your solution you have null records for the Release Year, do not include them.
This challenge was updated to propose 2 start files and 2 solutions.
... View more

Labels:
14
328
Hi Maveryx,
We are launching an updated process to submit Cloud Quest solutions!
Starting today and moving forward we will provide a JSON workflow start file for each quest. The workflow contains starting data preloaded into a Text Input tool (or tools).
Upload this JSON file into your Alteryx Analytics Cloud Library, then you can open the file and start solving the quest in Designer Cloud!
Similarly, once you are finished, you can export your JSON solution file to attach to your reply on Community.
Remember to attach your solution file to your reply on Community to get credit towards your Cloud Quest badge count.
Please continue to upload a screenshot of your solution workflow so other Maveryx can check out your creativity!
Review the following instructions to learn how to import and export Alteryx Designer Cloud workflows.
Import the Cloud Quest Start File
Download the provided JSON start file and upload it into your Analytics Cloud library.
Open the workflow in Designer Cloud.
Start solving!
Export Your Solution
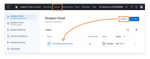
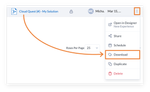
Once you have completed your quest, go back to your Analytics Cloud library.
Download your workflow solution file.
Upload your JSON file as an attachment to your comment.
Now, with that out of the way...
Let’s dive into this week's quest!
You are a data analyst at a sports statistics firm. Your department is focused on analyzing historical data from major international sporting events, and your current project is the FIFA Women’s World Cup™.
You have been provided with a dataset named Womens World Cup dataset. This file contains detailed Women's World Cup match records, including teams, match outcomes, and dates from 2016 through 2019.
Your goal is to use Alteryx Designer Cloud to process this dataset and determine which team won the most matches in years 2016-2018. The outcome should consist of two columns: one for the team and the other for the number of wins.
Hint: Use the IF/THEN expression in the Formula tool to identify the winners. Also, ensure to exclude any matches where there was a tie.
A combination of the Sample, Filter, Summarize, and Formula tools should solve your problem, but not necessarily in this sequence.
If you find yourself struggling with any of the tasks, feel free to explore these interactive lessons in the Maveryx Academy for guidance:
Getting Started with Designer Cloud
Building Connections in Designer Cloud
Building Your Workflow in Designer Cloud
Here’s to a successful quest!
... View more
Labels:
3
29
A solution to last week’s challenge can be found here.
It's vacation time. Will your flight leave on time?
Are you getting ready for vacation and worrying about the long hours of delay at airports? This is always in the back of our minds as we make a flight reservation, isn't it? Let's look at how bad flight delays were in the summer of 2021, which officially started on June 21 and ended on September 22.
Based on the dataset Flights_2021, which contains a random sample of all the flights in 2021, and the two tables provided, let's find the following information:
1. What were the five top airlines with more delays that summer? 2. What Airline had the longest delayed time that summer? On what date? 3. What were the top five airports with more flights delayed that summer? 4. How many flights were canceled that summer?
Note: CRS_Dep_Time= Scheduled Departure Time (local time: hhmm) Dep_Time: Actual Departure Time (local time: hhmm) Dep_Delay: Difference in minutes between scheduled and actual departure time. Early departures show negative numbers.
Thank you for your comments, this challenge has been updated.
... View more

Labels:
11
221
Hi Maveryx,
A solution to last week’s challenge can be found here. The inspiration for this challenge was submitted by Nathan Purvis (@DataNath) and was based on a Community discussion. Nathan, we appreciate your active participation in the Community!
March 31 marks the end of the first quarter of the year. During the following 2 weeks of April, your company is dedicating its time to evaluating their operational processes from the first quarter and suggesting improvements aimed at enhancing efficiency in the upcoming months.
The provided dataset contains information about the working shifts of all five employees, starting from their first day of work in January 2023 (not necessarily January 1), and spanning through March 31, 2023.
Your tasks for this challenge are as follows:
Build a table that displays each employee's total shifts during this period, the number of shifts that exceed 4 hours, shifts below 4 hours, and total non-work days.
For each employee, calculate the percentage of shifts that had fewer than 4 hours.
Bonus Question: In the event the company decides to expand its operations without bringing on new hires, which employee(s) (Employee_ID) should be considered for additional working hours?
If you need a little help, you can review these lessons in Academy:
Summarizing Data
Joining Data
Enjoy the challenge!
... View more


Labels:
- Labels:
- Basic
- Core
- Data Analysis
7
107
Hi, Team Maveryx!
A solution to last week’s challenge can be found here.
It is that time again—the Superbowl is just around the corner! To get ready, grab your favorite snacks, call over some friends, and dive into some football stats. A big shoutout to Kenda Sanderson (@kenda) for bringing us this fantastic challenge!
The Superbowl is about the best of the best! You will use the provided Fantasy Football dataset to determine which positions typically have the best rank and how that has changed over time.
Complete the following tasks to solve this challenge:
Determine the five positions (POS) with the lowest overall rank (RK) for all years.
Create a line graph and a table that clearly show the fluctuation in rank over time, specifically for those five positions.
Let's discover what fascinating insights you can extract from this challenge!
If you need a little help, you can review these lessons in Academy:
Connecting to Multiple Sheets at Once
Changing Data Layouts
Multi-Row Formula
Reporting in Designer (all lessons)
Source: https://fantasydata.com/nfl/fantasy-football-leaders?season=2018&seasontype=1&scope=1&subscope=1&startweek=1&endweek=1&aggregatescope=1&range=1
... View more


Labels:
4
80