Data Science
Machine learning & data science for beginners and experts alike.- Community
- :
- Community
- :
- Learn
- :
- Blogs
- :
- Data Science
- :
- Additions and Improvements in the Alteryx 9.1 Pred...
- Subscribe to RSS Feed
- Mark as New
- Mark as Read
- Bookmark
- Subscribe
- Printer Friendly Page
- Notify Moderator
 The process of expanding the capabilities and improving the performance of Alteryx's predictive analytics tools continues with Alteryx's 9.1 release. Specifically, we have added new tools for data investigation, predictive modeling, and time series analysis, and have made improvements and added new features to a number of existing tools as well, including the AB testing tools. Below, these additions, improvements, and enhancements are described in more detail.
Data Investigation
The two new tools added to the Data Investigation category are Pearson Correlation and the Distribution Analysis tools. The new Pearson Correlation tool replaces an earlier tool with the same name. The old tool allowed a user to calculate the Pearson correlation coefficient between two numeric fields in a data stream, while the new tool allows a user to select multiple numeric fields in a data stream and produces a Pearson correlation matrix, as an Alteryx table, that looks at the correlation between each pair of selected fields. This can also be done using the Association Analysis tool, but there are three important differences between these two tools. First, the Association Analysis tool reports the correlation matrix as a report (along with a table of t-tests of statistical significance), not as a data table that can be used downstream. Second, the Pearson Correlation tool only creates a Pearson correlation matrix, and not the Spearman correlation matrix or the matrix of Hoeffding's D statistics that the Association Analysis tool can. Finally, the Pearson Correlation tool is a pure Alteryx tool, avoiding the in-memory scaling issues of open source R. In future releases, we are likely to take advantage of this in order to provide scalability enhancements to some of our existing tools (such as the Principal Components tool), so that they can work with greater data volumes than is now possible.
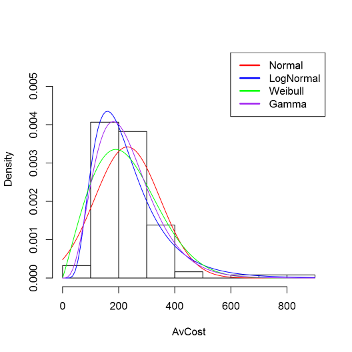
The new Distribution Analysis tool allows a user to determine which commonly used statistical distribution best captures the distribution of a numeric field of interest. The type of analysis the tool implements is most often used to determine the distribution of a target variable so that an appropriate traditional statistical model can be selected. In other words, it allows a user to determine whether the Linear or Gamma Regression Model tool should be used for a particular target field, or whether a target variable should be natural log transformed before developing a model with the Linear Regression tool. The theoretical statistical distributions available for comparison are the Normal, Log Normal, Gamma, and Weibull distributions. A visual comparison between the empirical distribution (in the form of a histogram) and fits of the data to the selected theoretical distribution(s) is provided. Different tests (Chi-Square, Anderson-Darling, Cramer-von Mises, and Kolmogorov-Smirnov) are provided that test the hypothesis of whether the empirical distribution statistically differs from a particular theoretical distribution. If our target variable of interest is not different from a Gamma distribution, but is statistically different from a Normal distribution, it suggests that the Gamma Regression tools is more appropriate than the Linear Regression tool for modeling this target variable.
Predictive Modeling
The three new predictive modeling tools are Neural Network, Naive Bayes, and Support Vector Machine (more commonly referred to as SVM). These three tools all come out of the field of machine learning as opposed to statistics (where most of our other predictive modeling tools originated), and have been the subject of a number of customer requests in recent months. In addition, Naive Bayes and SVM are both very amenable to parallelization, so can readily scale to very large data sets (something we currently have in the works, but not yet in Alteryx). In addition to the new tools, there have been further refinements in the Score tool to allow models (such as the Decision Tree and Boosted Model) which are able to produce scores even in the absence of information about some of the predictor fields to do so, rather than return Null values.
Neural network models were one of the first machine learning algorithms applied to predictive modeling applications. The motivation behind the method is mimicking the structure of neurons in the brain (hence the method's name). The basic structure of a neural network involves a set of inputs (predictor fields) that feed into one or more "hidden" layers, with each hidden layer having one or more "nodes" (also known as "neurons"). The specific type of neural network model the Neural Network tool implements is a feedforward perceptron with a single hidden layer. While more modern statistical learning methods (such as models produced by the Boosted, Forest, and Spline Model tools) typically provide greater predictive efficacy relative to neural network models, in some specific applications (which cannot be determined before the fact) neural network models outperform other methods for both classification (categorical target) and regression (numeric target) problems. Moreover, in some areas, such as in financial risk assessment, neural network models are considered a "standard" method that is widely accepted.
The Naive Bayes tool creates a binomial (often of the "yes or no" variety) or multinomial (did "a", "b", or "c" happen) probabilistic classification model of the relationship between a set of predictor variables and a categorical target variable. The Naive Bayes classifier assumes that all predictor variables are independent of one another (often a very strong assumption in business applications) and predicts, based on a training sample, a probability distribution over the set of classes (categories) of the target variable. The main advantages of the Naive Bayes classifier relative to many other classification algorithms is that it performs relatively well even when there is little data available, but it can also readily scale, through the use of a parallelized algorithm, to very large data sets. These two advantages both derive from the fact that the model is paramaterized by the mean and variance of each predictor independent of the other predictors.
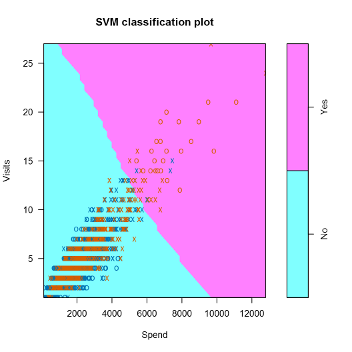
Support vector machines have become the "go to" method in the machine learning field for both classification and regression models. The reason for their popularity is they often work well, and parallel algorithms have been developed that enable the method to scale to large data volumes. The objective of the method is to find "lines" (true lines in two dimensions, planes in three dimensions, and hyperplanes in four or more dimensions) in the space of the predictor fields that separates the records into groups, where the members of each group all belong to the same class of the target field. Typically, finding these "lines" using the original scaling of the predictor fields isn't possible, so the predictor fields are rescaled, through the use of kernel smoothers, so that appropriate "lines" can be found in the transformed space. The approach of this algorithm is very different from other predictive modeling tools, which enables this method to outperform others in some applications.
Time Series
The major change to the time series tools in the 9.1 release of Alteryx is the ability to expand beyond univariate time series models (which use systematic patterns in past values of the target field to predict future values), to now allow for the use of "covariates" (predictor fields) to augment past values of the target field. Covariates can only be included in ARIMA models and not exponential smoothing models (which are created in Alteryx using the ETS tool). In some instances the use of covariates can greatly improve forecast accuracy, but in many instances they do not. A recent blog post of mine provides something of a case study on selecting covariates to include in an ARIMA forecasting model.
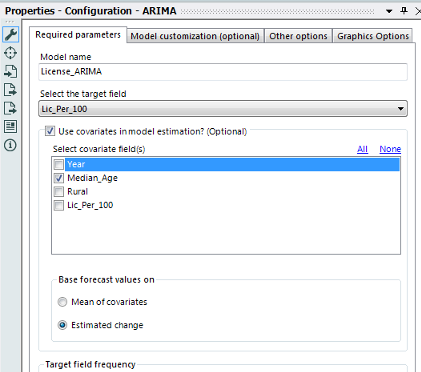
Changes have been made to the ARIMA and TS Compare tools to allow for the use of covariates. The changes in the TS Compare tool are "under the hood" in nature, but the ARIMA tool's interface has been changed in order to allow a user to select one or more covariates to include in a model, and to indicate the method the user wants to use in order to extrapolate values of the covariate(s) into the future for plotting purposes (not for producing actual model forecasts). To provide forecasts for ARIMA models with covariates, the TS Covariate Forecast tool has been introduced. The nature of Alteryx macros prevented us from simply adding this capability to the existing TS Forecast tool in a way that would not break existing modules that include this tool. The only difference between the TS Covariate Forecast and TS Forecast tools is that the TS Covariate Forecast tool requires a second input that consists of an Alteryx data stream that contains the values of covariates that correspond to the user's desired forecast horizon.
The other tool that has been introduced to Alteryx's collection of time series tools is the TS Filler tool. This is really a data preparation tool for time series data that "fills in" appropriate missing date records in order to maintain a consistent time series. Dealing with missing date records is important for both time series modeling and for A/B testing applications, where data ranges are used to define the comparison and test periods. To illustrate the purpose of this tool, consider the daily sales data for a retailer whose stores are closed on Thanksgiving and Christmas day. In this case, these two days will likely be missing from each store's sales records due to the store closure. This will cause the time series to deviate from a regular pattern. To address this issue, the TS Filler tool will insert records for Thanksgiving and Christmas day into the data, restoring the regular time series. Only the date field in the inserted records will have non-Null values (there are no sensible default values to use that meet the needs of general use cases), so the user will likely need to impute values for some of the other fields (e.g., changing the value of a "Sales" field from Null to zero) using other Alteryx tools such as the Imputation tool.
AB Testing
Incremental improvements have been made to the AB Trend and AB Analysis tools. The AB Trend tool now allows the user to select two-week, three-week, and four-week time intervals as reporting periods for the data in addition to the daily, weekly, monthly, and quarterly periods that were previously allowed. In addition, there have been a number of improvements and fixes that have been made to the report generated by the AB Analysis tool.
Looking Forward
The changes to the predictive tools for the 9.1 release represent a continued maturing and filling out of Alteryx's existing predictive analytics capabilities. Going forward, we have three initiatives planned. First, we are working on a set of "starter kits" that will provide users with a detailed roadmap for applying Alteryx's predictive analytics and other tools to address a particular issue such as churn analysis, inventory management, credit scorecards, and a number of others. The second initiative, which is previewed as part of the blog post mentioned above is bringing interactive visualizations into our predictive analytics tools. The third initiative, which is closely tied to Ned Harding's recent post, is aimed at allowing advanced analytics algorithms to be carried out in-database or in-Hadoop (bringing the algorithm to the data, and not the data to the algorithm), while maintaining Alteryx's "no coding" user experience.
There is a lot of work ahead of us at Alteryx, but we think you will like the results.

Chief Scientist
Dr. Dan Putler is the Chief Scientist at Alteryx, where he is responsible for developing and implementing the product road map for predictive analytics. He has over 30 years of experience in developing predictive analytics models for companies and organizations that cover a large number of industry verticals, ranging from the performing arts to B2B financial services. He is co-author of the book, “Customer and Business Analytics: Applied Data Mining for Business Decision Making Using R”, which is published by Chapman and Hall/CRC Press. Prior to joining Alteryx, Dan was a professor of marketing and marketing research at the University of British Columbia's Sauder School of Business and Purdue University’s Krannert School of Management.
Dr. Dan Putler is the Chief Scientist at Alteryx, where he is responsible for developing and implementing the product road map for predictive analytics. He has over 30 years of experience in developing predictive analytics models for companies and organizations that cover a large number of industry verticals, ranging from the performing arts to B2B financial services. He is co-author of the book, “Customer and Business Analytics: Applied Data Mining for Business Decision Making Using R”, which is published by Chapman and Hall/CRC Press. Prior to joining Alteryx, Dan was a professor of marketing and marketing research at the University of British Columbia's Sauder School of Business and Purdue University’s Krannert School of Management.
You must be a registered user to add a comment. If you've already registered, sign in. Otherwise, register and sign in.